Oklahoma City, OK Investment Properties for Sale
Browse homes for sale and investment properties in Oklahoma City, OK. Refine your search by price, property type, or more.
Best cash flowing properties in Oklahoma City, OK
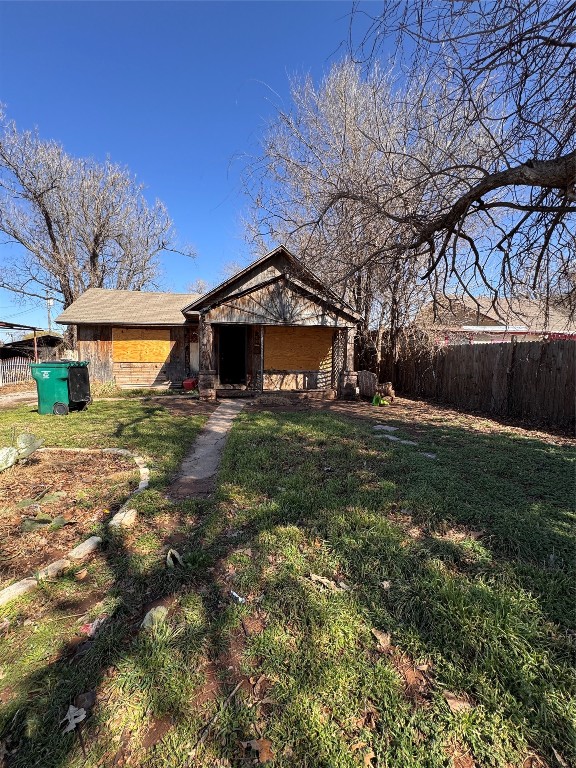
$46,000
2
bds
|
1
ba
|
0
sqft
|
built
1920
3 SW 41st St, Oklahoma City, OK 73109
$789
Cash flow
20.0%
Cash-on-Cash Return
20.6%
Cap rate
2.6%
Rent to Value Ratio
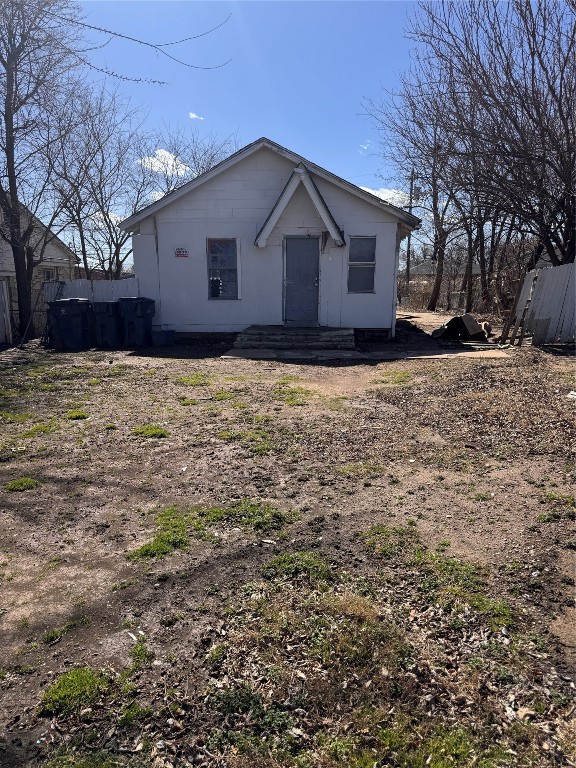
$70,000
2
bds
|
1
ba
|
0
sqft
|
built
1940
516 SW 46th St, Oklahoma City, OK 73109
$702
Cash flow
11.7%
Cash-on-Cash Return
12.0%
Cap rate
1.6%
Rent to Value Ratio
1,173 out of 1,668 properties for sale in Oklahoma City, OK
Limited Results Shown
Create a free account, or log in to reveal all property listings and enjoy the complete experience.
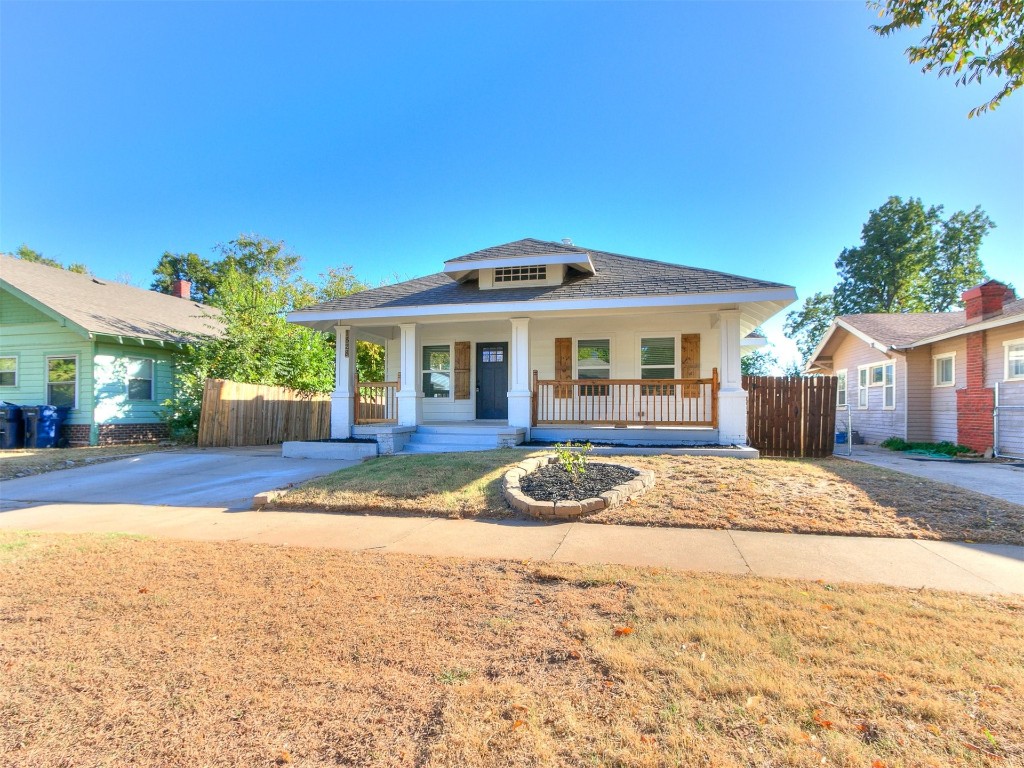
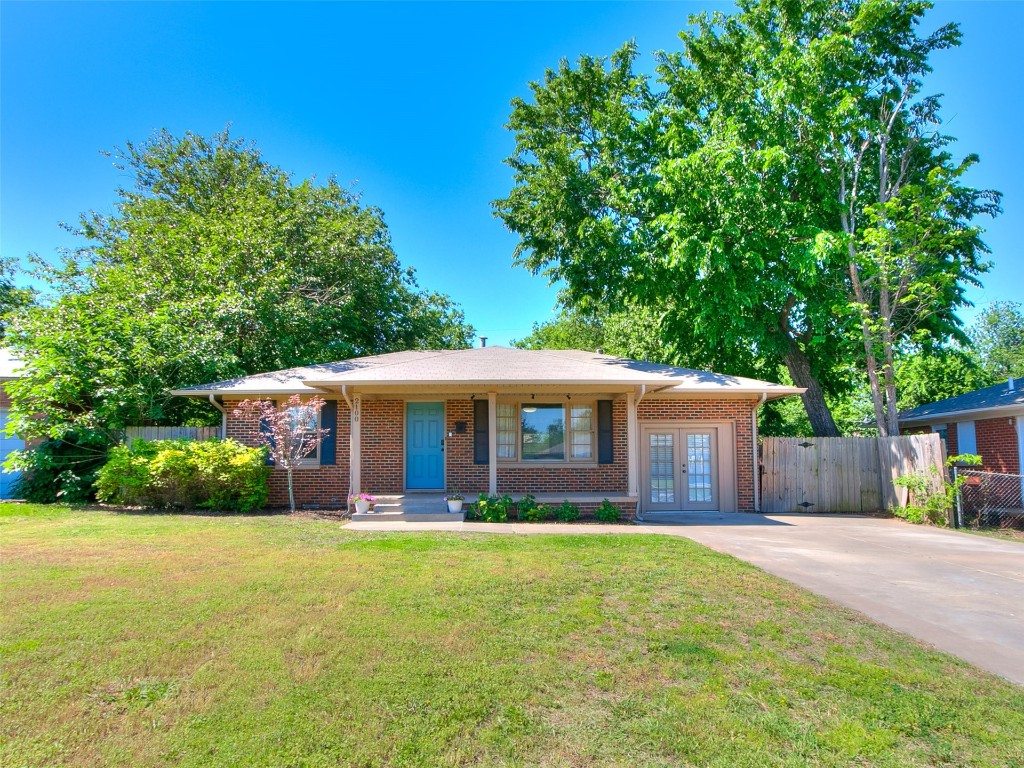
$245,000
3
bds
|
1
ba
|
0
sqft
|
built
1917
1828 W Park Pl, Oklahoma City, OK 73106
$20
Cash flow
0.4%
Cash-on-Cash Return
5.8%
Cap rate
0.7%
Rent to Value Ratio
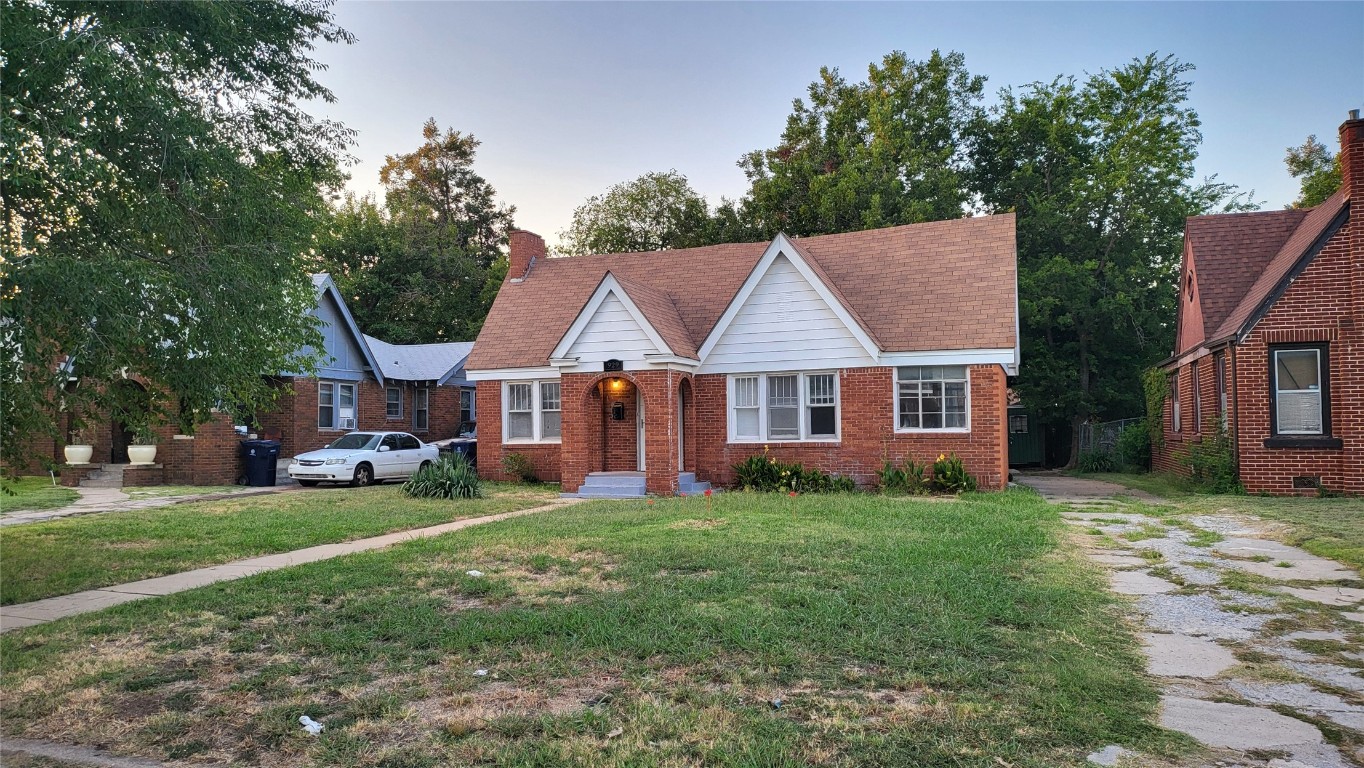
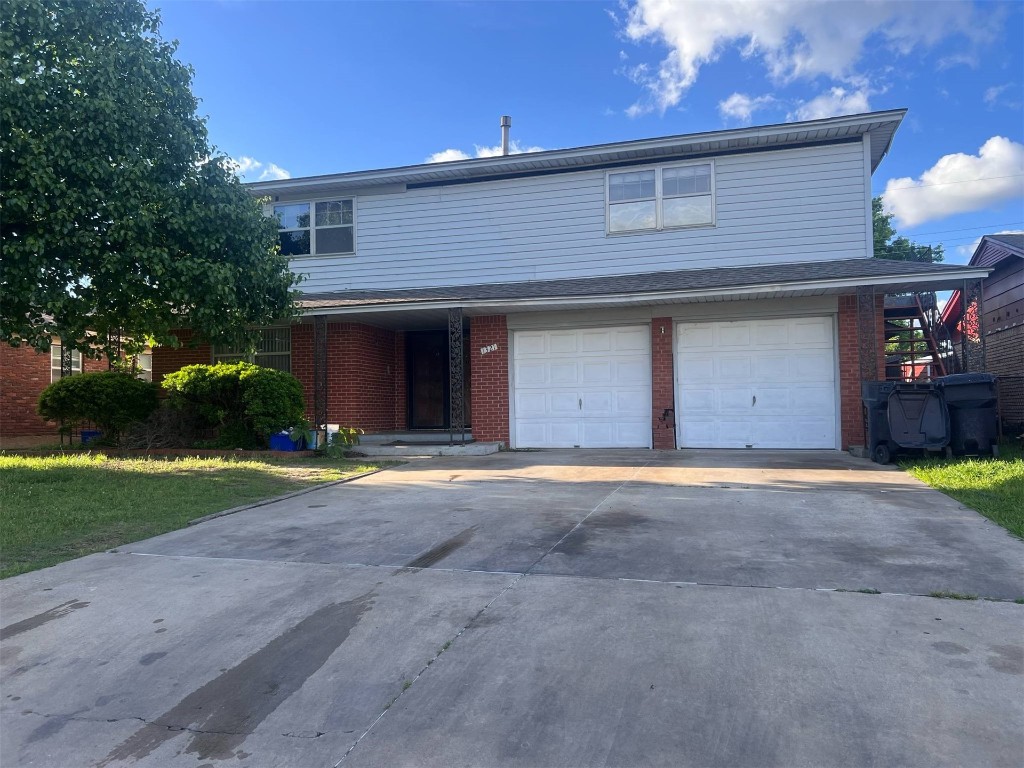
$205,000
3
bds
|
3
ba
|
0
sqft
|
built
1927
929 NE 17th St, Oklahoma City, OK 73105
$60
Cash flow
1.5%
Cash-on-Cash Return
6.0%
Cap rate
0.8%
Rent to Value Ratio
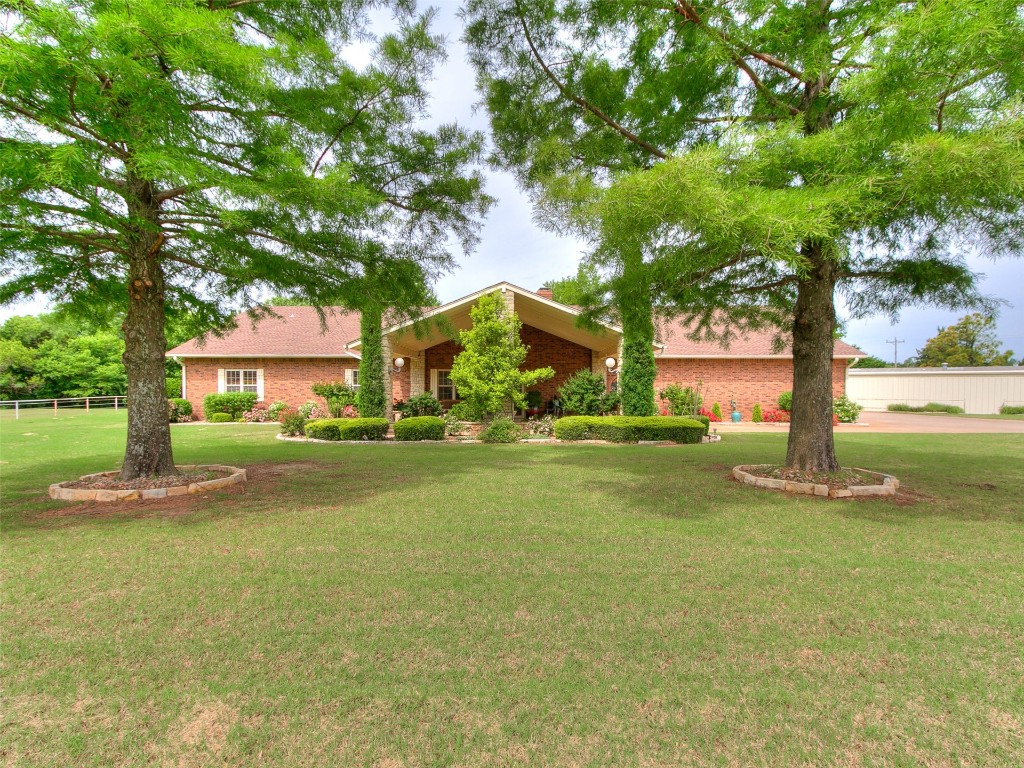
$329,900
3
bds
|
2
ba
|
0
sqft
|
built
1956
6201 N Styll Rd, Oklahoma City, OK 73112
$-305
Cash flow
-4.8%
Cash-on-Cash Return
4.6%
Cap rate
0.7%
Rent to Value Ratio
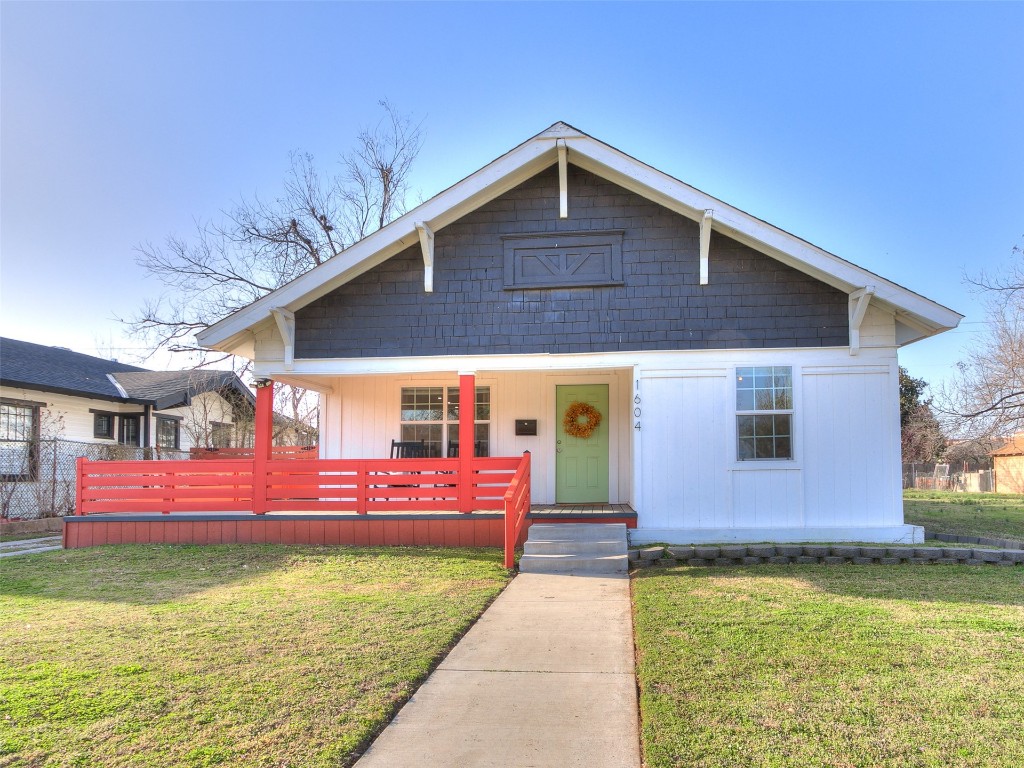
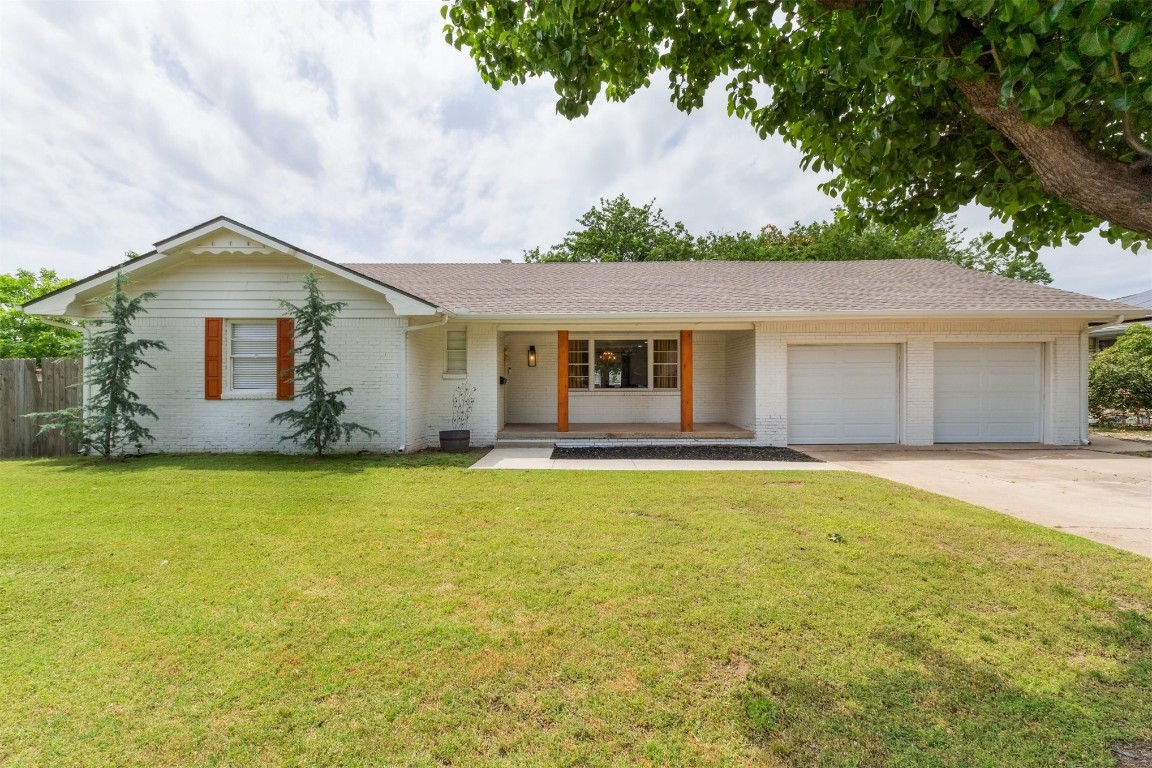
$300,000
4
bds
|
3
ba
|
0
sqft
|
built
1925
1604 NW 29th St, Oklahoma City, OK 73106
$-145
Cash flow
-2.5%
Cash-on-Cash Return
5.1%
Cap rate
0.7%
Rent to Value Ratio
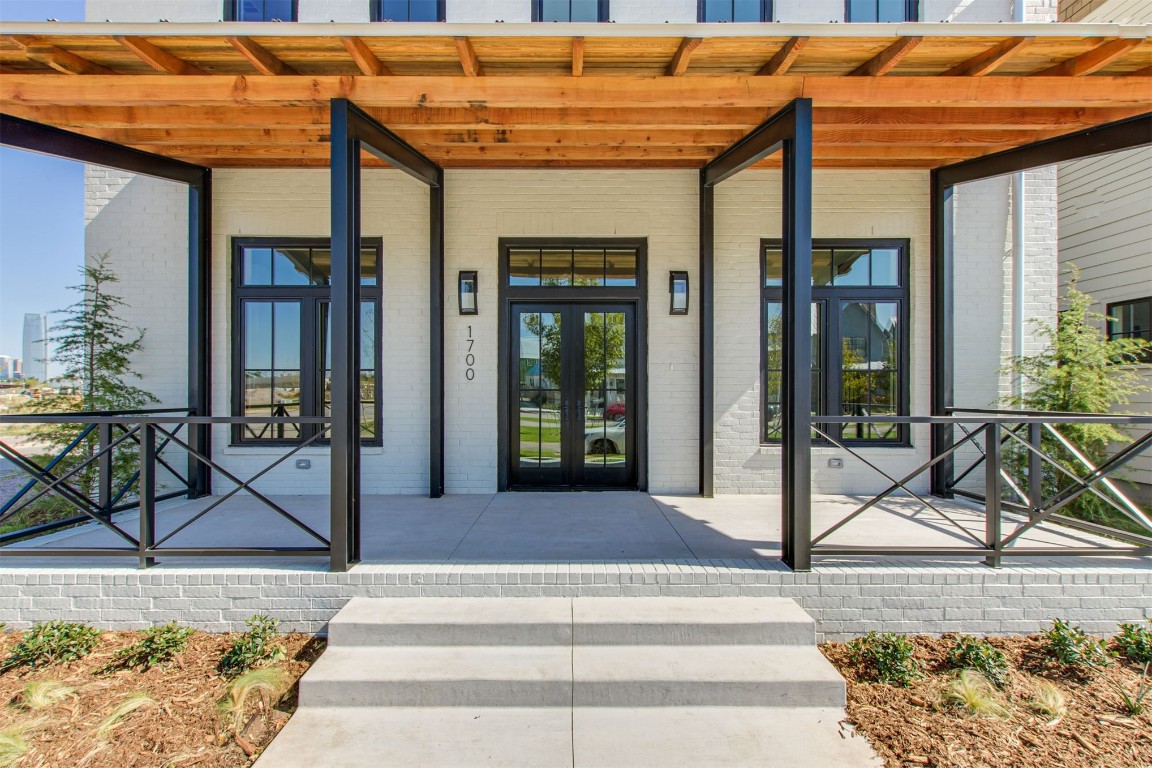
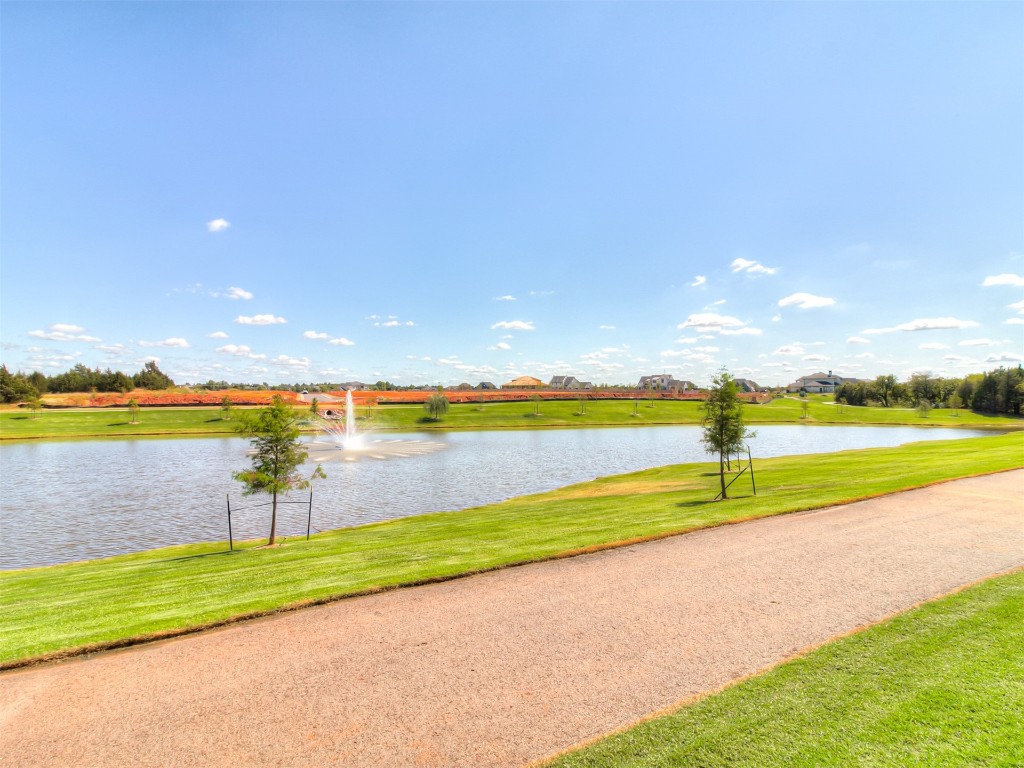
$1,200,000
4
bds
|
4
ba
|
0
sqft
|
built
2021
1700 Runway Blvd, Oklahoma City, OK 73108
$-4,754
Cash flow
-20.7%
Cash-on-Cash Return
0.9%
Cap rate
0.3%
Rent to Value Ratio
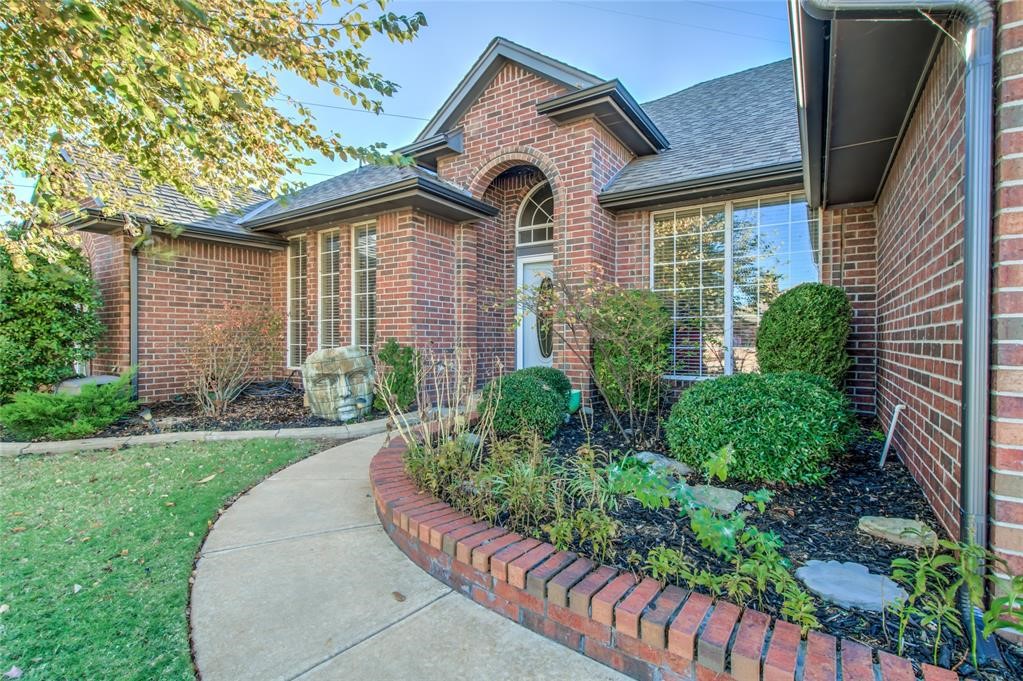
$371,000
3
bds
|
2
ba
|
0
sqft
|
built
1999
10401 York Way, Oklahoma City, OK 73162
$-460
Cash flow
-6.5%
Cash-on-Cash Return
4.2%
Cap rate
0.6%
Rent to Value Ratio
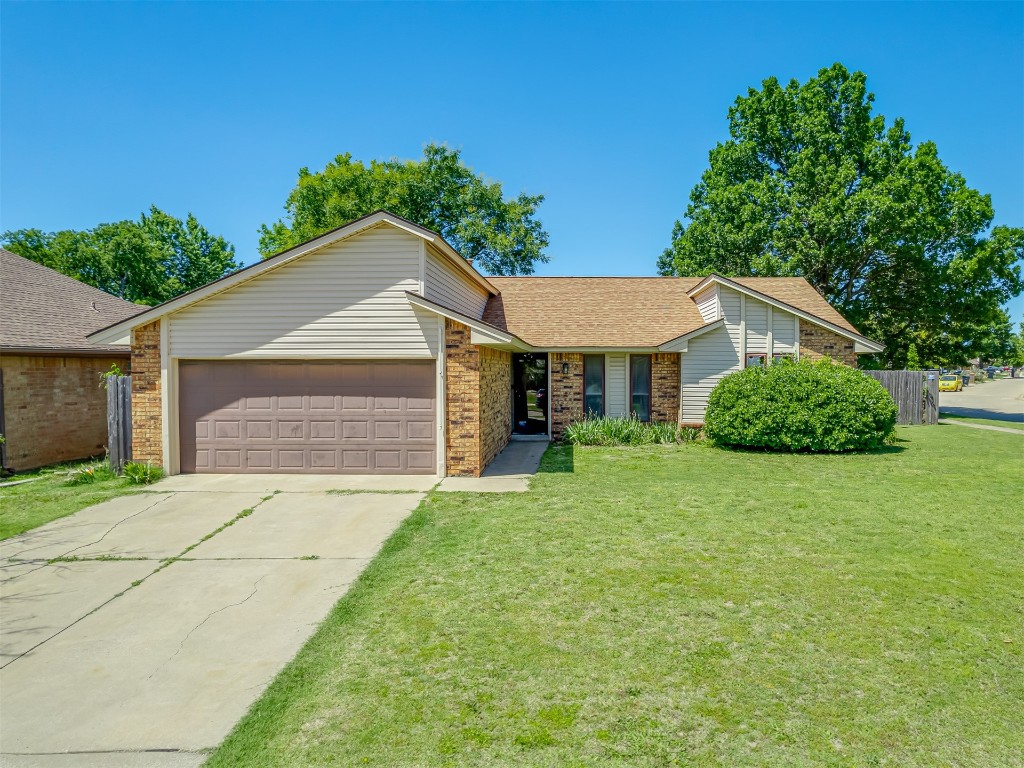
$249,900
3
bds
|
2
ba
|
0
sqft
|
built
1950
2100 Hasley Dr, Oklahoma City, OK 73120
$-210
Cash flow
-4.4%
Cash-on-Cash Return
4.7%
Cap rate
0.7%
Rent to Value Ratio

$774,900
3
bds
|
3
ba
|
0
sqft
|
built
1994
1101 Mc Laughlin Dr, Oklahoma City, OK 73170
$-1,788
Cash flow
-12.0%
Cash-on-Cash Return
2.9%
Cap rate
0.5%
Rent to Value Ratio
$258,900
5
bds
|
3
ba
|
0
sqft
|
built
1961
1321 SW 62nd St, Oklahoma City, OK 73159
$-27
Cash flow
-0.5%
Cash-on-Cash Return
5.6%
Cap rate
0.8%
Rent to Value Ratio
$718,000
3
bds
|
2
ba
|
0
sqft
|
built
1985
8501 S Council Rd, Oklahoma City, OK 73169
$-983
Cash flow
-7.1%
Cash-on-Cash Return
4.0%
Cap rate
0.5%
Rent to Value Ratio
$70,000
2
bds
|
1
ba
|
0
sqft
|
built
1940
516 SW 46th St, Oklahoma City, OK 73109
$702
Cash flow
11.7%
Cash-on-Cash Return
12.0%
Cap rate
1.6%
Rent to Value Ratio
$1,265,000
4
bds
|
4
ba
|
0
sqft
|
built
2022
15012 Annecy Blvd, Oklahoma City, OK 73142
$-4,692
Cash flow
-19.4%
Cash-on-Cash Return
1.2%
Cap rate
0.3%
Rent to Value Ratio
$249,900
3
bds
|
2
ba
|
0
sqft
|
built
1983
11008 Davis St, Oklahoma City, OK 73162
$-251
Cash flow
-5.2%
Cash-on-Cash Return
4.5%
Cap rate
0.6%
Rent to Value Ratio
$228,000
3
bds
|
2
ba
|
0
sqft
|
built
1949
2109 Brighton Ave, Oklahoma City, OK 73120
$-63
Cash flow
-1.4%
Cash-on-Cash Return
5.3%
Cap rate
0.8%
Rent to Value Ratio
$405,000
3
bds
|
3
ba
|
0
sqft
|
built
2004
1017 SW 107th St, Oklahoma City, OK 73170
$-3,645
Cash flow
-47.0%
Cash-on-Cash Return
-5.1%
Cap rate
0.6%
Rent to Value Ratio
$46,000
2
bds
|
1
ba
|
0
sqft
|
built
1920
3 SW 41st St, Oklahoma City, OK 73109
$789
Cash flow
20.0%
Cash-on-Cash Return
20.6%
Cap rate
2.6%
Rent to Value Ratio
$189,900
3
bds
|
2
ba
|
0
sqft
|
built
1954
3032 NW 67th St, Oklahoma City, OK 73116
$-72
Cash flow
-2.0%
Cash-on-Cash Return
5.2%
Cap rate
0.8%
Rent to Value Ratio
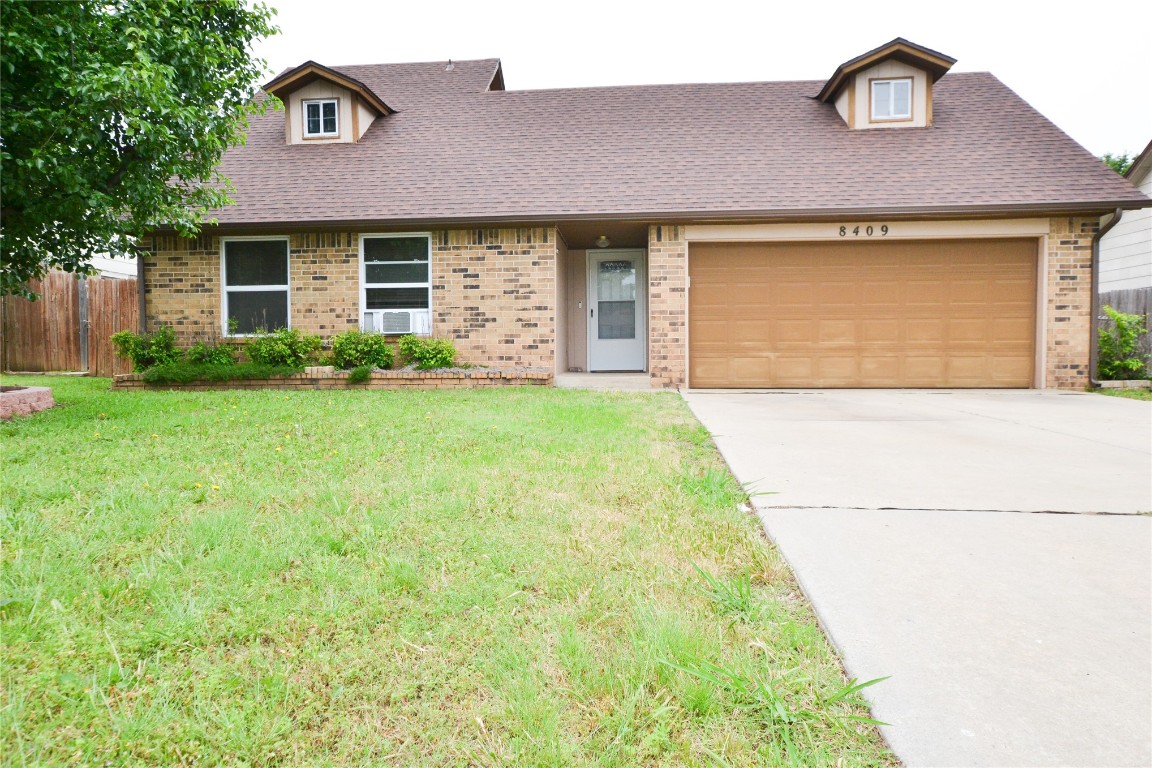
$210,000
4
bds
|
3
ba
|
0
sqft
|
built
1987
8409 Bigwood Dr, Oklahoma City, OK 73135
$-93
Cash flow
-2.3%
Cash-on-Cash Return
5.1%
Cap rate
0.8%
Rent to Value Ratio
$549,000
4
bds
|
3
ba
|
0
sqft
|
built
1955
1609 Westchester Dr, Oklahoma City, OK 73120
$-1,382
Cash flow
-13.1%
Cash-on-Cash Return
2.7%
Cap rate
0.4%
Rent to Value Ratio

$285,000
2
bds
|
2
ba
|
0
sqft
|
built
2001
4505 NW 119th St, Oklahoma City, OK 73162
$-395
Cash flow
-7.2%
Cash-on-Cash Return
4.0%
Cap rate
0.7%
Rent to Value Ratio
$224,900
3
bds
|
2
ba
|
0
sqft
|
built
1971
10912 N Florida Ave, Oklahoma City, OK 73120
$-119
Cash flow
-2.8%
Cash-on-Cash Return
5.0%
Cap rate
0.7%
Rent to Value Ratio

$575,000
5
bds
|
4
ba
|
0
sqft
|
built
2015
3001 Sunset Blvd, Oklahoma City, OK 73120
$-986
Cash flow
-8.9%
Cash-on-Cash Return
3.6%
Cap rate
0.6%
Rent to Value Ratio
$220,000
3
bds
|
3
ba
|
0
sqft
|
built
1960
1126 SW 19th St, Oklahoma City, OK 73108
$-18
Cash flow
-0.4%
Cash-on-Cash Return
5.6%
Cap rate
0.7%
Rent to Value Ratio
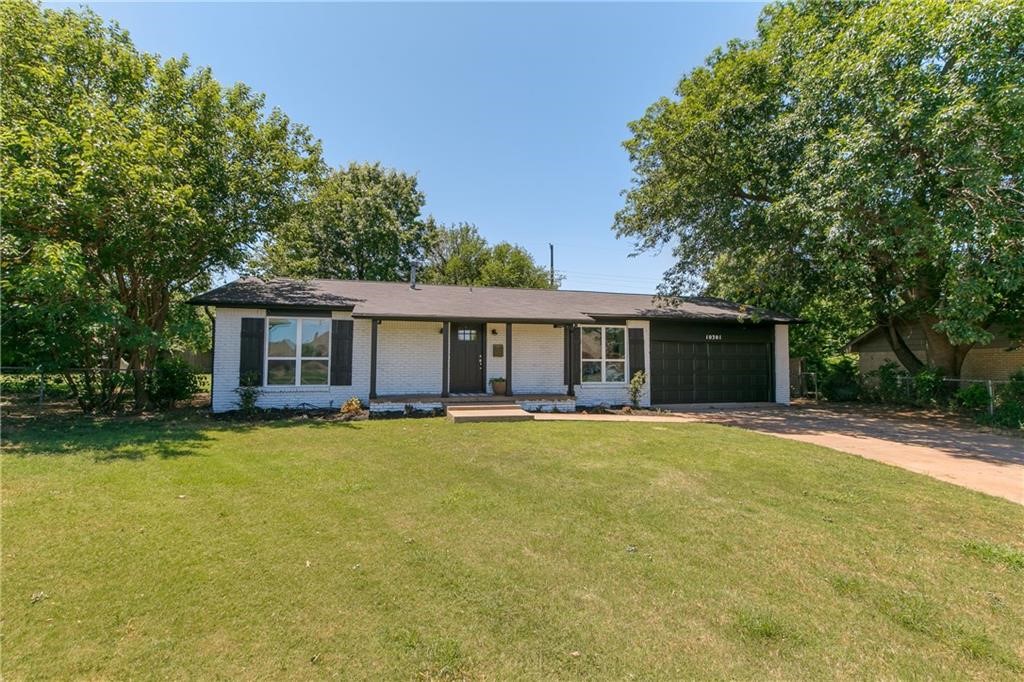
$175,000
3
bds
|
1
ba
|
0
sqft
|
built
1956
3701 NW 59th Ter, Oklahoma City, OK 73112
$118
Cash flow
3.5%
Cash-on-Cash Return
6.5%
Cap rate
0.9%
Rent to Value Ratio
$458,900
4
bds
|
3
ba
|
0
sqft
|
built
1999
12208 Endor Dr, Oklahoma City, OK 73170
$-807
Cash flow
-9.2%
Cash-on-Cash Return
3.6%
Cap rate
0.6%
Rent to Value Ratio

$150,000
2
bds
|
1
ba
|
0
sqft
|
built
1930
1801 N Jordan Ave, Oklahoma City, OK 73111
$-42
Cash flow
-1.5%
Cash-on-Cash Return
5.3%
Cap rate
0.7%
Rent to Value Ratio
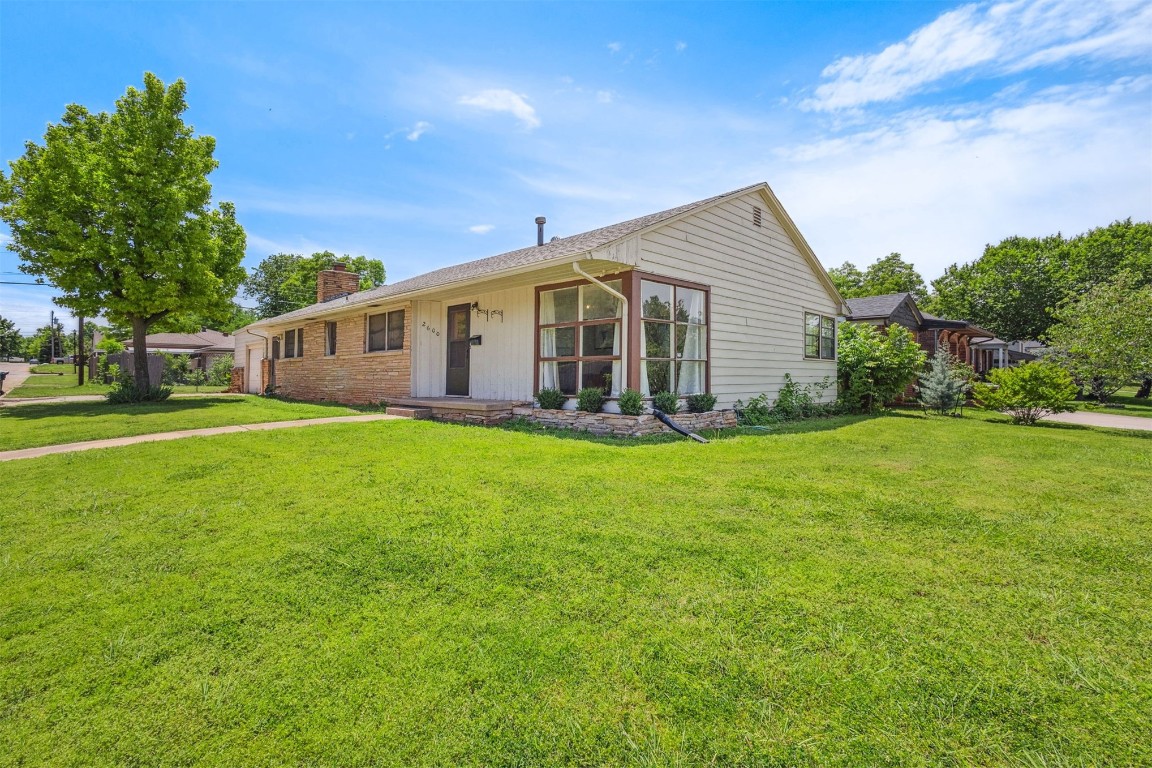
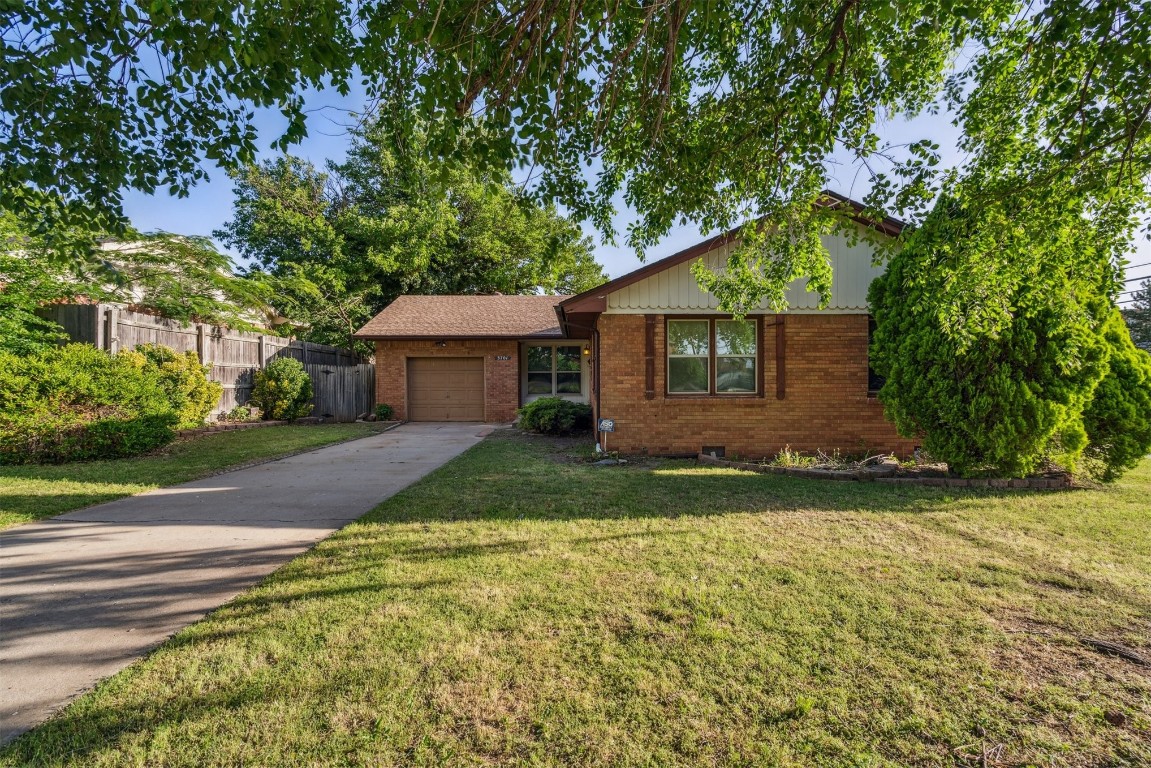
$199,000
3
bds
|
2
ba
|
0
sqft
|
built
1951
2600 NW 34th St, Oklahoma City, OK 73112
$-1
Cash flow
0.0%
Cash-on-Cash Return
5.7%
Cap rate
0.8%
Rent to Value Ratio
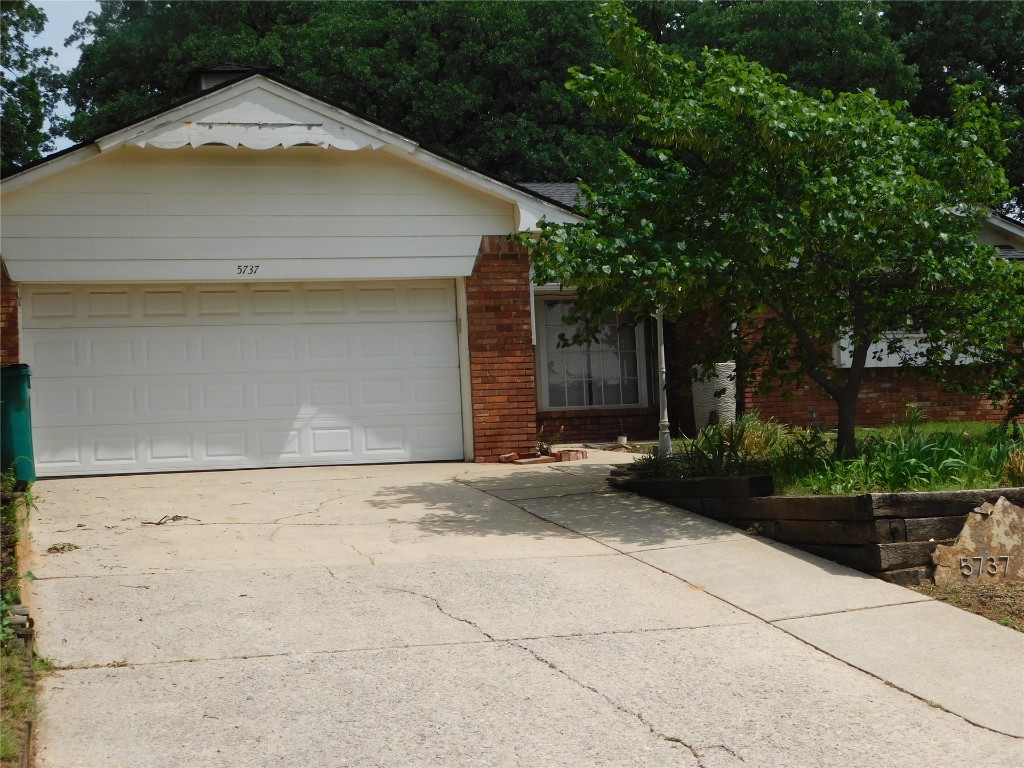
$229,900
3
bds
|
2
ba
|
0
sqft
|
built
1963
5737 NW 31st St, Oklahoma City, OK 73122
$-165
Cash flow
-3.7%
Cash-on-Cash Return
4.8%
Cap rate
0.7%
Rent to Value Ratio

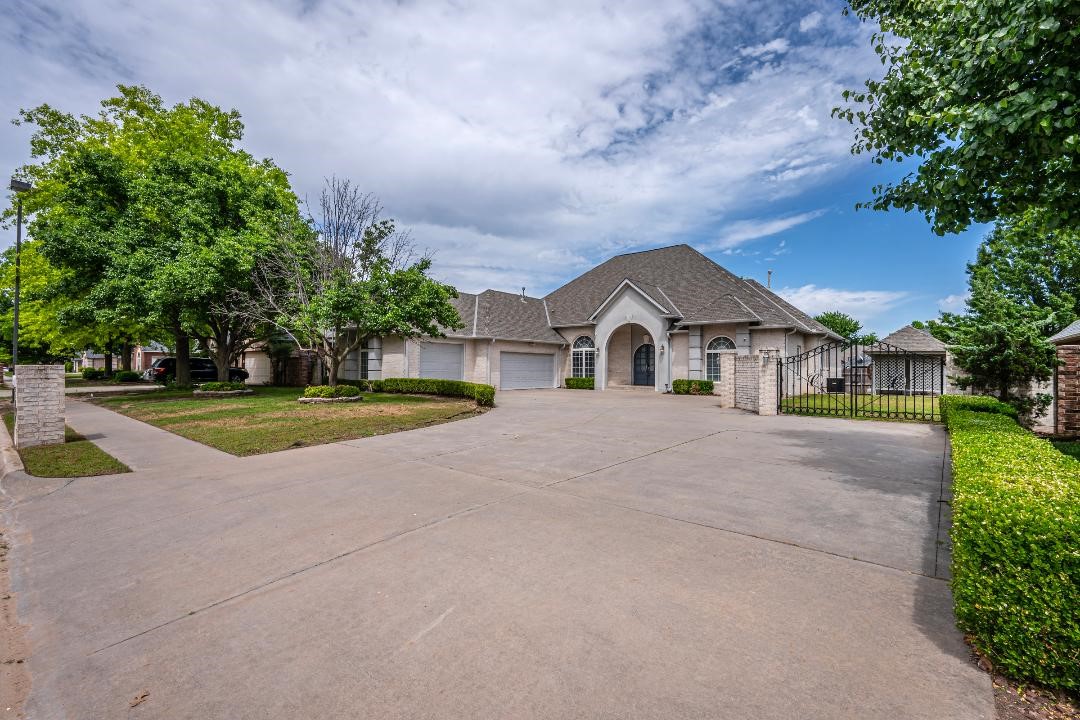
$300,000
5
bds
|
3
ba
|
0
sqft
|
built
1967
3004 Robin Ridge Rd, Oklahoma City, OK 73120
$-298
Cash flow
-5.2%
Cash-on-Cash Return
4.5%
Cap rate
0.8%
Rent to Value Ratio
$125,000
2
bds
|
1
ba
|
0
sqft
|
built
1949
4213 N Prospect Ave, Oklahoma City, OK 73111
$109
Cash flow
4.5%
Cash-on-Cash Return
6.7%
Cap rate
0.9%
Rent to Value Ratio
$365,000
3
bds
|
3
ba
|
0
sqft
|
built
2000
4419 SE 57th St, Oklahoma City, OK 73135
$-627
Cash flow
-9.0%
Cash-on-Cash Return
3.6%
Cap rate
0.5%
Rent to Value Ratio
$329,900
3
bds
|
3
ba
|
0
sqft
|
built
1965
3732 NW 69th Ter, Oklahoma City, OK 73116
$-498
Cash flow
-7.9%
Cash-on-Cash Return
3.9%
Cap rate
0.6%
Rent to Value Ratio
$149,999
3
bds
|
1
ba
|
0
sqft
|
built
1954
1619 SE 63rd St, Oklahoma City, OK 73149
$276
Cash flow
9.6%
Cash-on-Cash Return
7.9%
Cap rate
1.0%
Rent to Value Ratio

$125,000
3
bds
|
1
ba
|
0
sqft
|
built
1940
2200 Hardin Dr, Oklahoma City, OK 73111
$188
Cash flow
7.8%
Cash-on-Cash Return
7.5%
Cap rate
1.0%
Rent to Value Ratio
$239,900
3
bds
|
2
ba
|
0
sqft
|
built
1980
809 Wandering Way, Oklahoma City, OK 73170
$-116
Cash flow
-2.5%
Cash-on-Cash Return
5.1%
Cap rate
0.7%
Rent to Value Ratio
$320,000
3
bds
|
2
ba
|
0
sqft
|
built
1962
10301 Sunset Blvd, Oklahoma City, OK 73120
$-581
Cash flow
-9.5%
Cash-on-Cash Return
3.5%
Cap rate
0.6%
Rent to Value Ratio
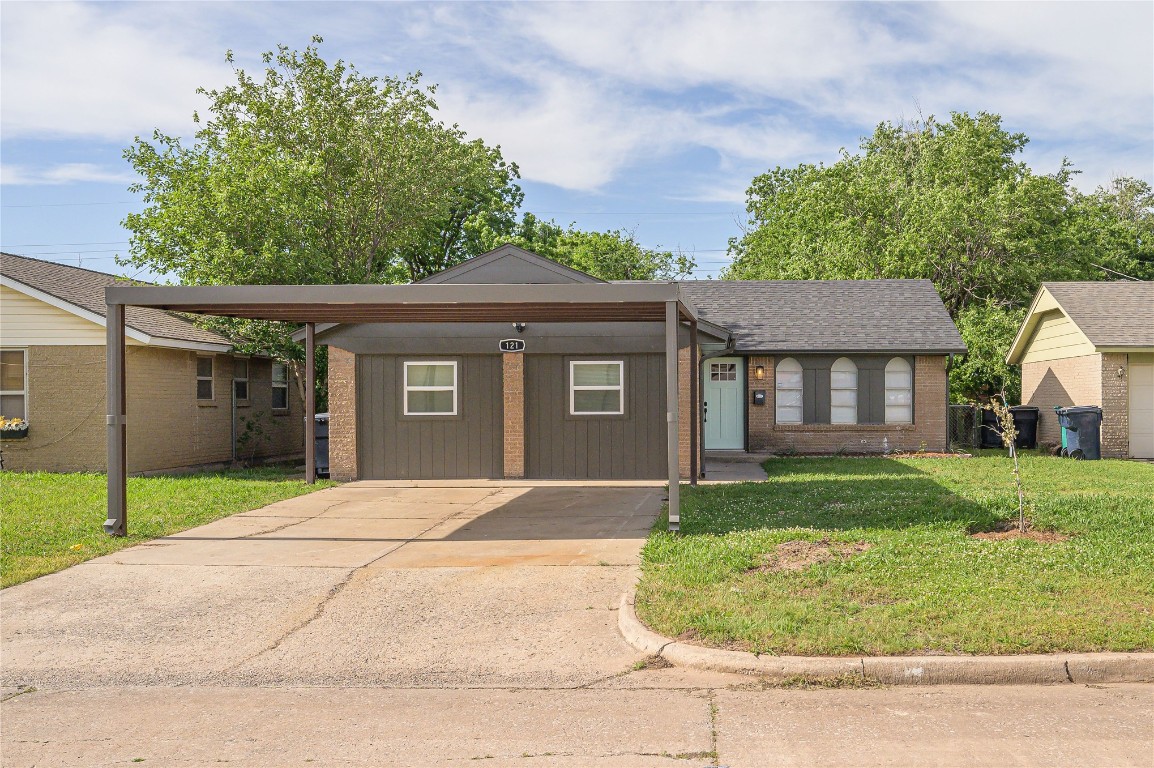
$199,750
5
bds
|
2
ba
|
0
sqft
|
built
1972
121 NW 79th St, Oklahoma City, OK 73114
$-146
Cash flow
-3.8%
Cash-on-Cash Return
4.8%
Cap rate
0.7%
Rent to Value Ratio
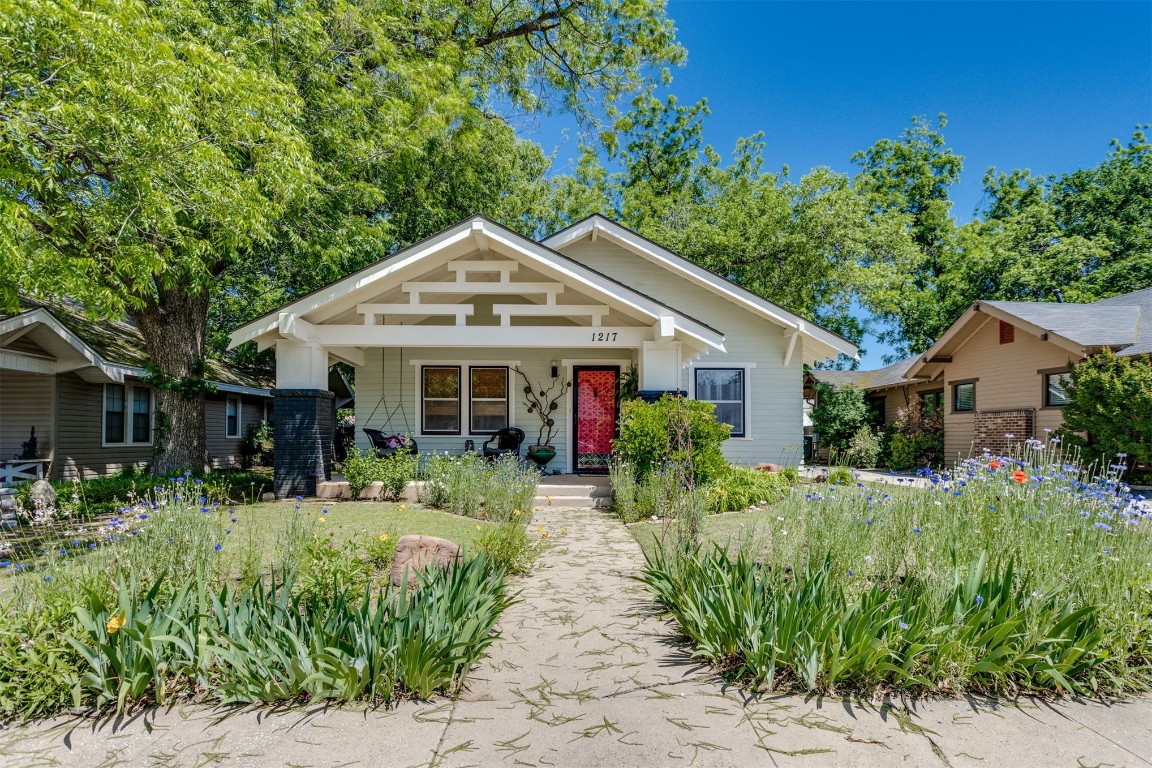
$285,000
2
bds
|
1
ba
|
0
sqft
|
built
1918
1217 NW 44th St, Oklahoma City, OK 73118
$-513
Cash flow
-9.4%
Cash-on-Cash Return
3.5%
Cap rate
0.5%
Rent to Value Ratio
$159,900
2
bds
|
1
ba
|
0
sqft
|
built
1928
3237 NW 14th St, Oklahoma City, OK 73107
$90
Cash flow
2.9%
Cash-on-Cash Return
6.4%
Cap rate
0.9%
Rent to Value Ratio
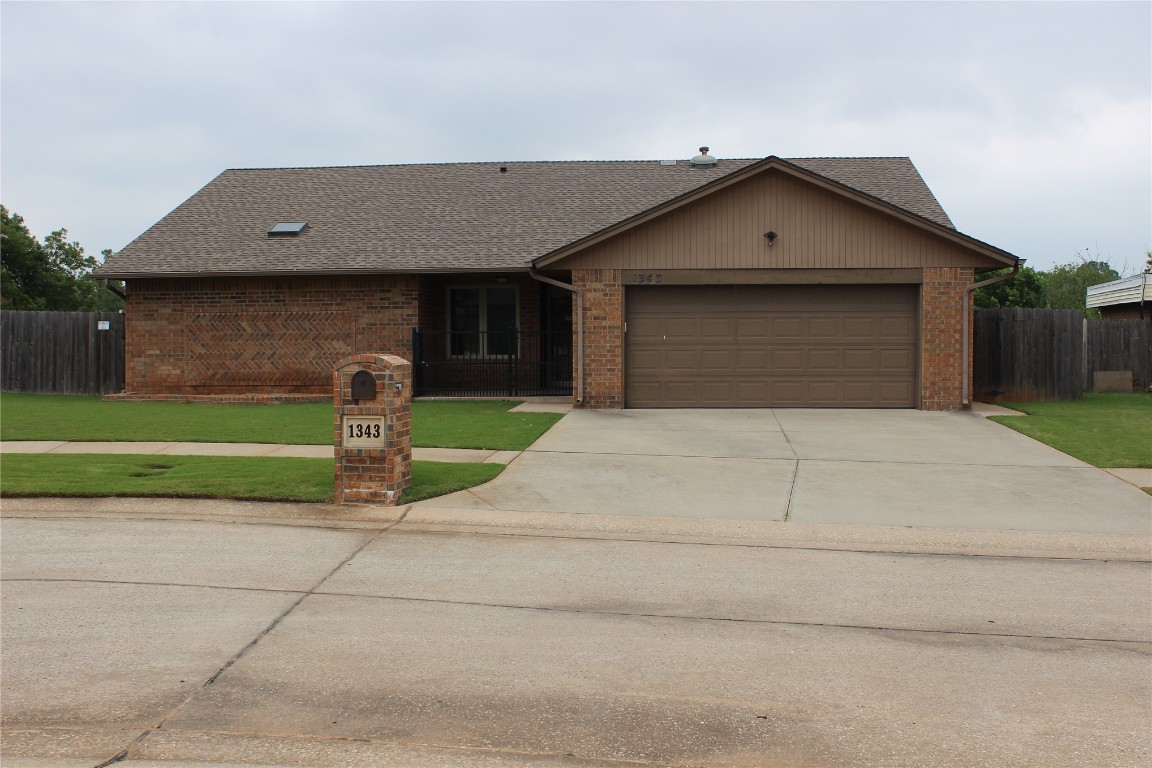
$255,000
3
bds
|
2
ba
|
0
sqft
|
built
1979
1343 Lowrie Ln, Oklahoma City, OK 73159
$-223
Cash flow
-4.6%
Cash-on-Cash Return
4.6%
Cap rate
0.7%
Rent to Value Ratio