Miami Beach, FL Investment Properties for Sale
Browse homes for sale and investment properties in Miami Beach, FL. Refine your search by price, property type, or more.
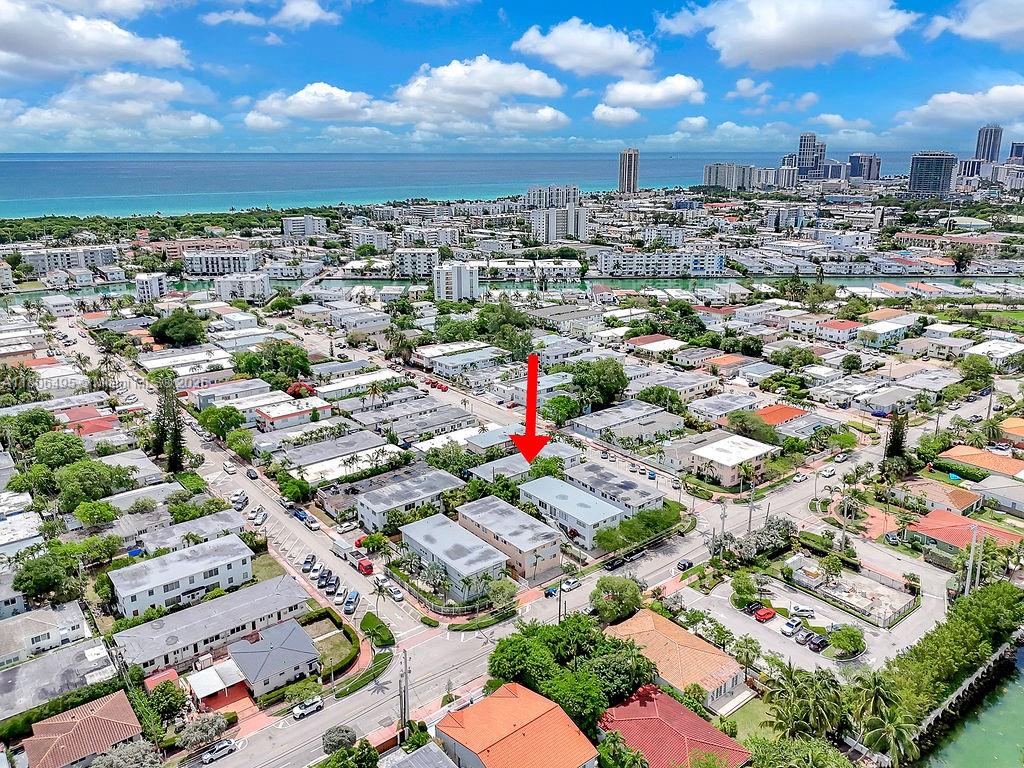
Best cash flowing properties in Miami Beach, FL

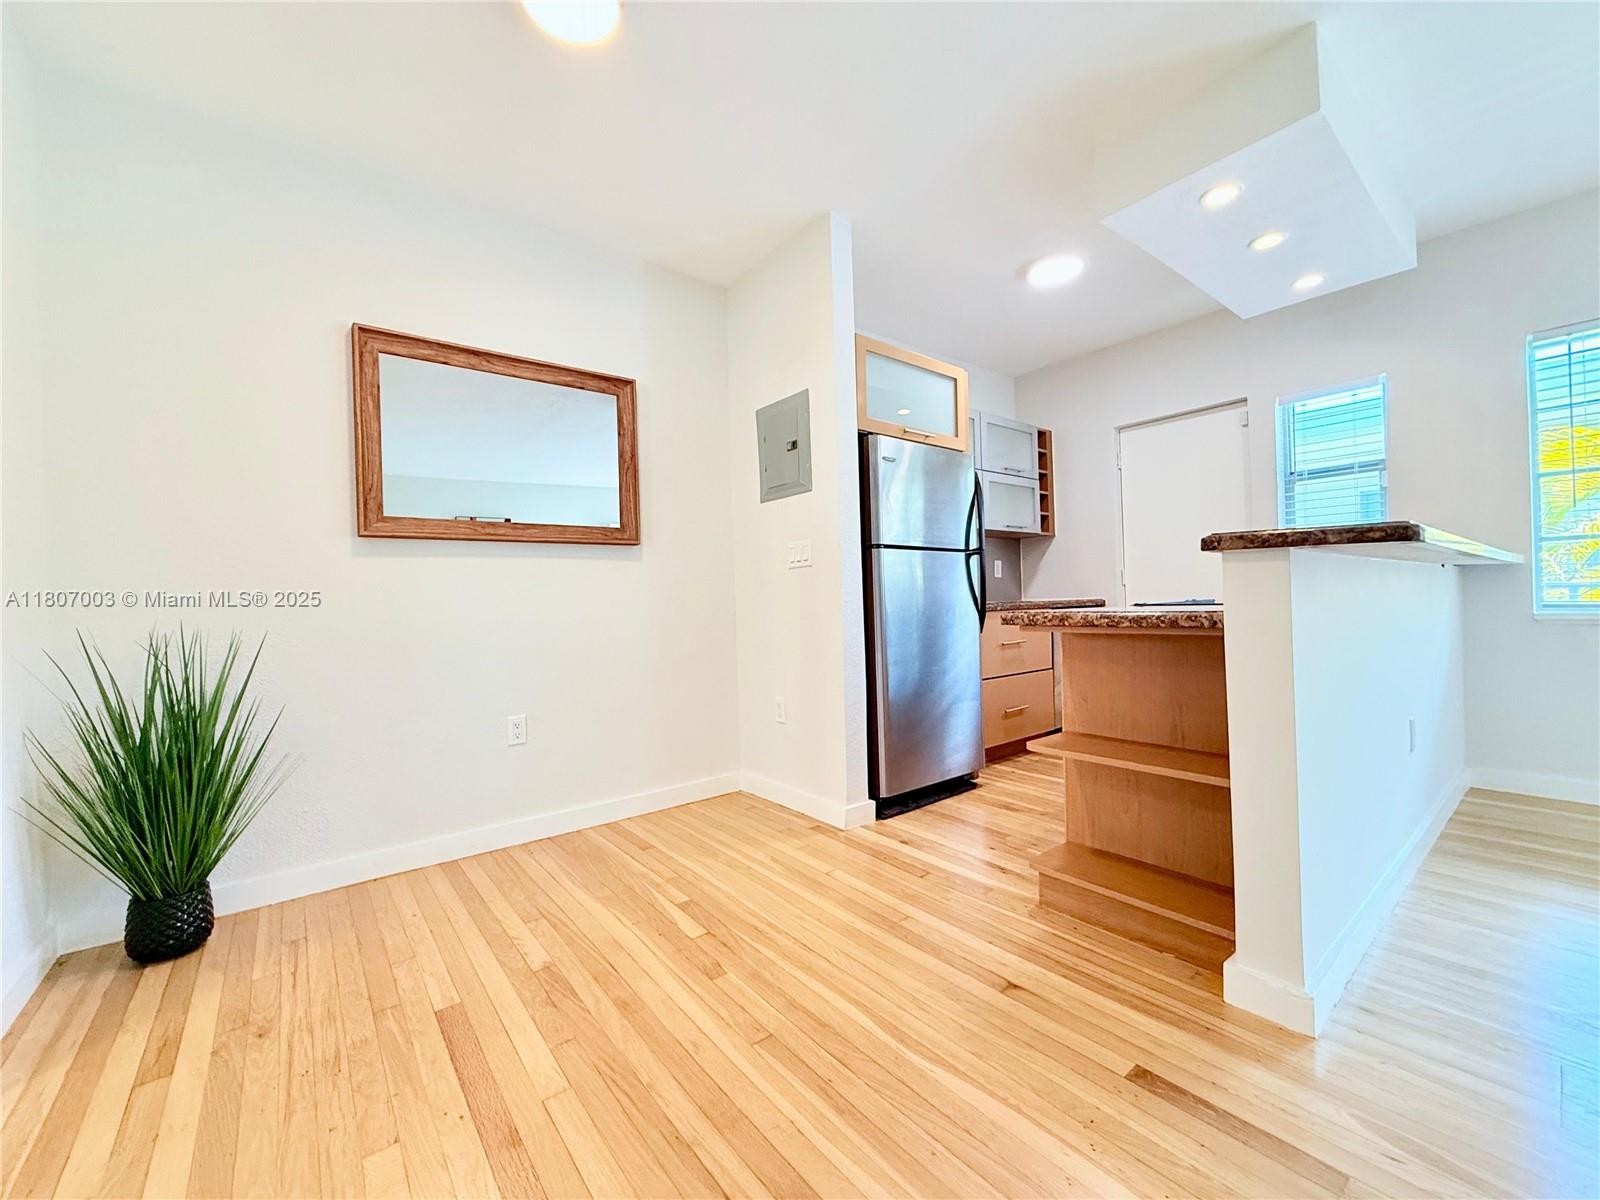
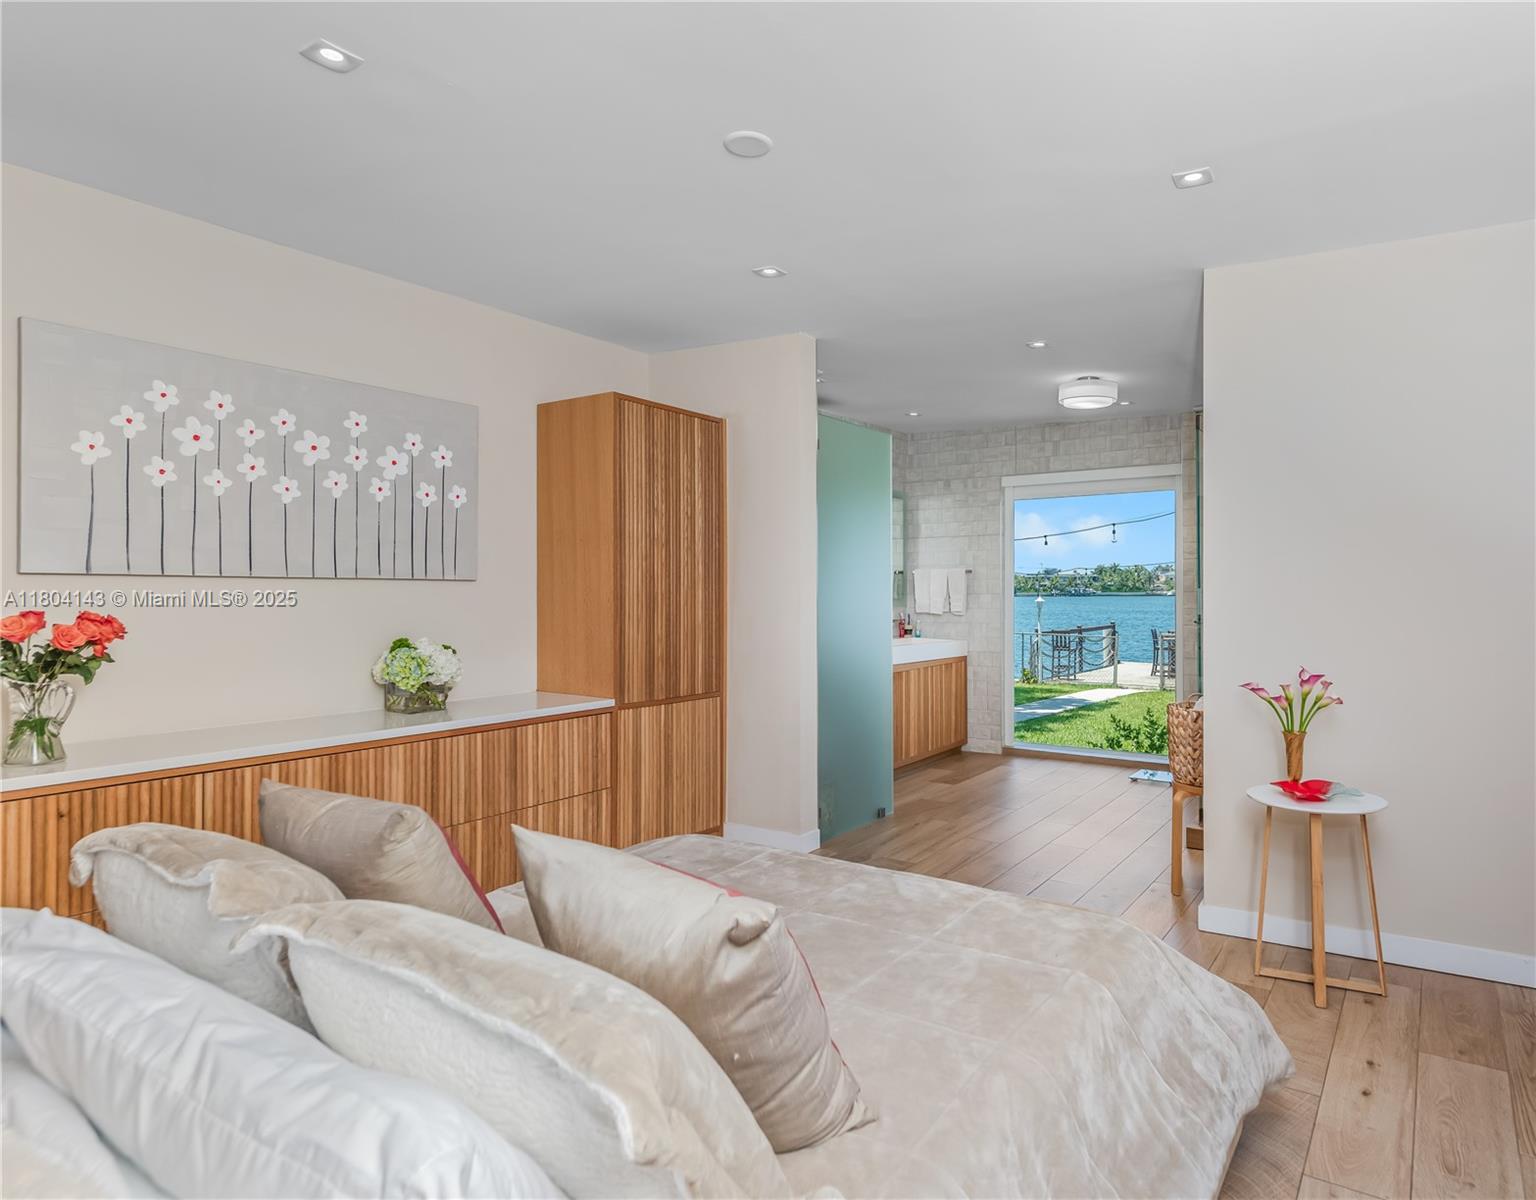
$550,000
2
bds
|
2
ba
|
1,935
sqft
|
built
1967
5640 Collins Ave, Miami Beach, FL 33140
$780
Cash flow
7.4%
Cash-on-Cash Return
7.8%
Cap rate
1.0%
Rent to Value Ratio
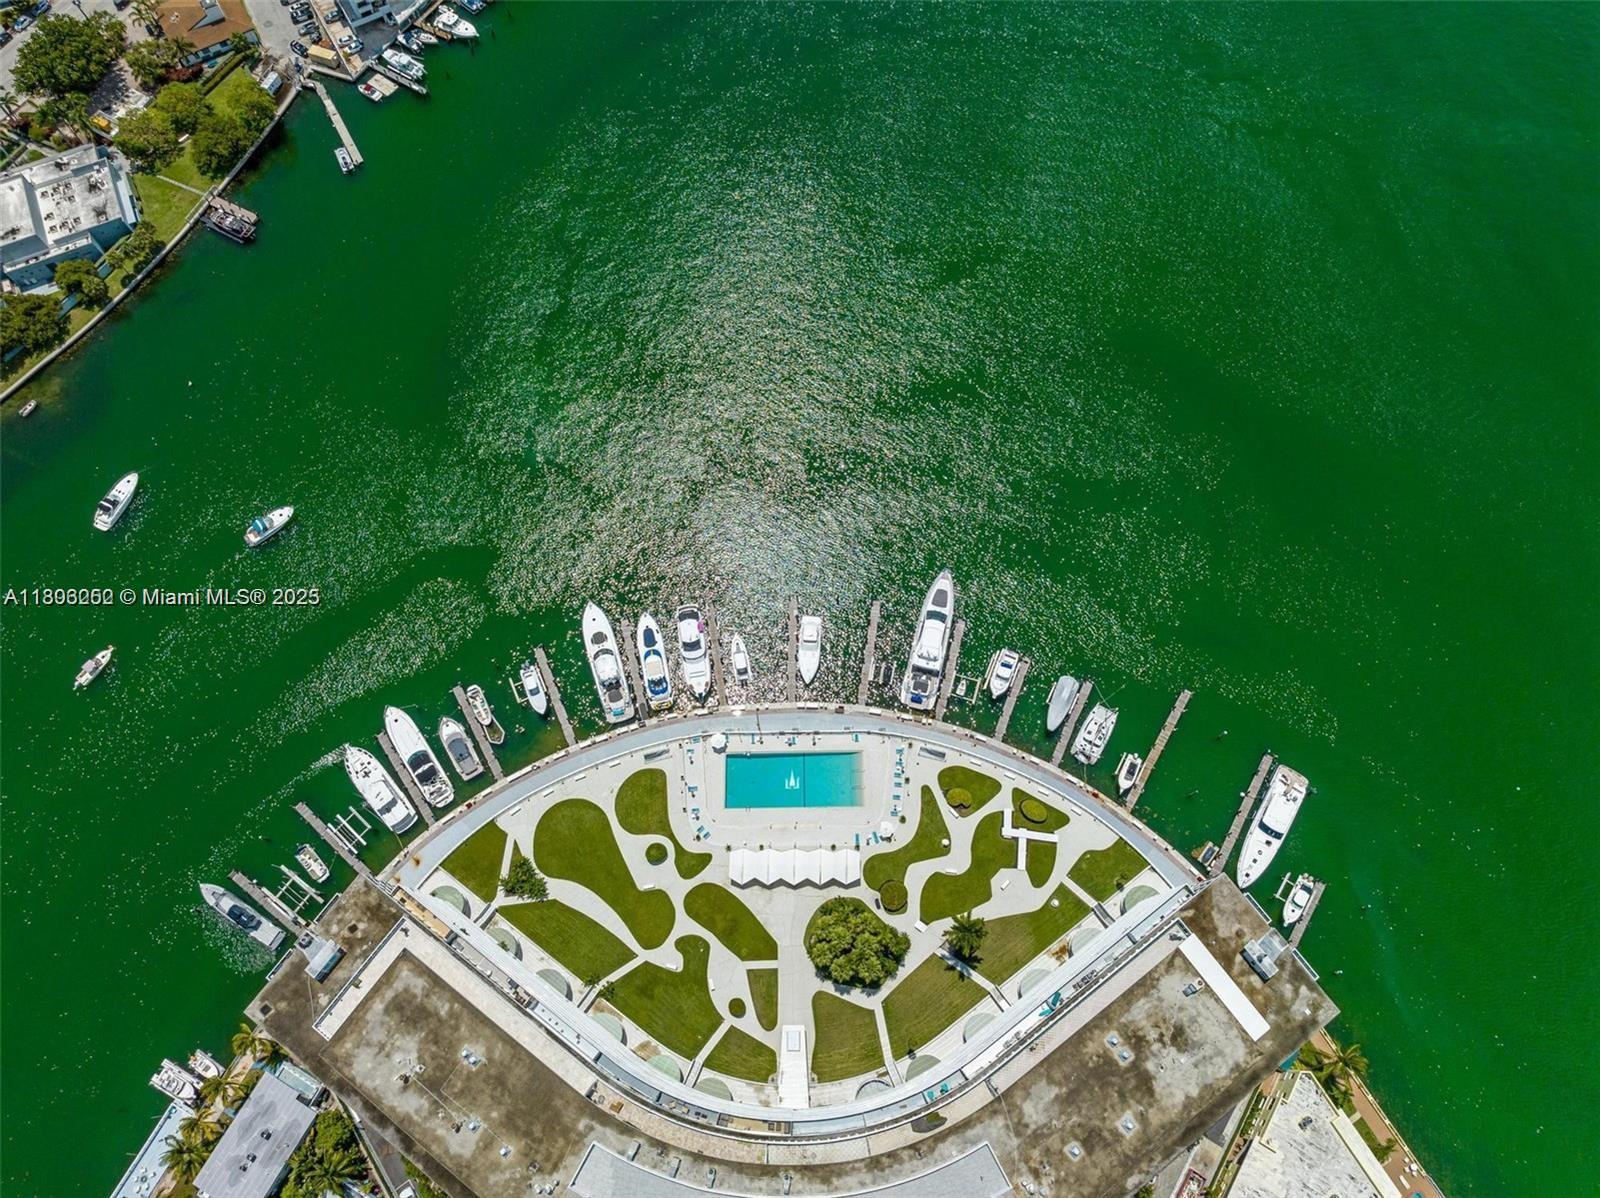
$6,250,000
3
bds
|
4
ba
|
4,185
sqft
|
built
2021
4700 N Meridian Ave, Miami Beach, FL 33140
n/a
Cash flow
n/a
Cash-on-Cash Return
n/a
Cap rate
n/a
Rent to Value Ratio
2,088 out of 2,333 properties for sale in Miami Beach, FL
Limited Results Shown
Create a free account, or log in to reveal all property listings and enjoy the complete experience.
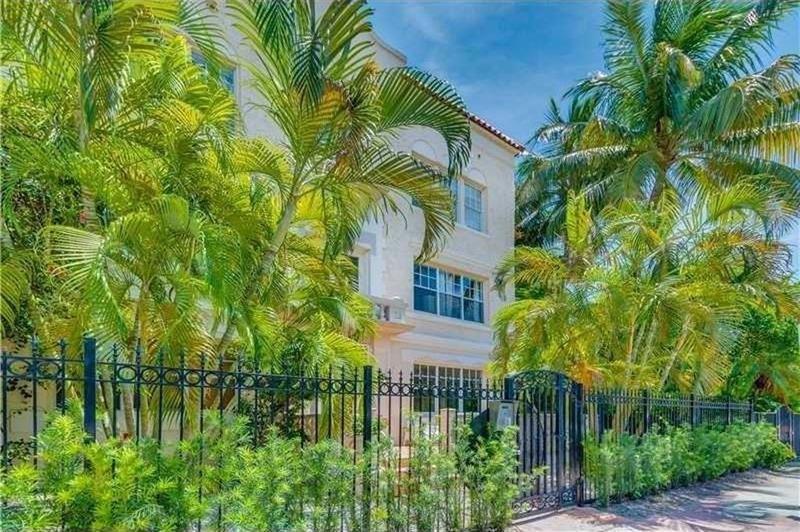
$2,690,000
2
bds
|
2
ba
|
1,290
sqft
|
built
2008
6899 Collins Ave, Miami Beach, FL 33141
$-11,312
Cash flow
-21.9%
Cash-on-Cash Return
1.1%
Cap rate
0.4%
Rent to Value Ratio

$264,000
1
bds
|
1
ba
|
410
sqft
|
built
1976
710 Washington Ave, Miami Beach, FL 33139
$-969
Cash flow
-19.2%
Cash-on-Cash Return
1.7%
Cap rate
0.8%
Rent to Value Ratio
$489,000
1
bds
|
2
ba
|
1,075
sqft
|
built
1963
900 Bay Dr, Miami Beach, FL 33141
$-829
Cash flow
-8.8%
Cash-on-Cash Return
4.1%
Cap rate
0.6%
Rent to Value Ratio
$340,000
1
bds
|
2
ba
|
676
sqft
|
built
1971
6969 Collins Ave, Miami Beach, FL 33141
$-1,181
Cash flow
-18.1%
Cash-on-Cash Return
2.0%
Cap rate
0.7%
Rent to Value Ratio
$349,000
2
bds
|
2
ba
|
700
sqft
|
built
1938
1611 Michigan Ave, Miami Beach, FL 33139
$-1,009
Cash flow
-15.1%
Cash-on-Cash Return
2.7%
Cap rate
0.8%
Rent to Value Ratio

$1,649,000
2
bds
|
2
ba
|
1,147
sqft
|
built
1997
650 West Ave, Miami Beach, FL 33139
$-6,880
Cash flow
-21.8%
Cash-on-Cash Return
1.1%
Cap rate
0.4%
Rent to Value Ratio
$285,000
1
bds
|
1
ba
|
650
sqft
|
built
1958
1220 Alton Rd, Miami Beach, FL 33139
$-660
Cash flow
-12.1%
Cash-on-Cash Return
3.4%
Cap rate
0.8%
Rent to Value Ratio
$335,000
2
bds
|
2
ba
|
1,003
sqft
|
built
1963
900 Bay Dr, Miami Beach, FL 33141
$-1,185
Cash flow
-18.5%
Cash-on-Cash Return
1.9%
Cap rate
0.8%
Rent to Value Ratio
$16,500,000
5
bds
|
5
ba
|
5,303
sqft
|
built
2017
1379 N Venetian Way, Miami Beach, FL 33139
$-97,456
Cash flow
-30.8%
Cash-on-Cash Return
-0.9%
Cap rate
0.1%
Rent to Value Ratio
$750,000
1
bds
|
2
ba
|
825
sqft
|
built
1969
5701 Collins Ave, Miami Beach, FL 33140
$-3,650
Cash flow
-25.4%
Cash-on-Cash Return
0.3%
Cap rate
0.4%
Rent to Value Ratio
$319,000
1
bds
|
2
ba
|
910
sqft
|
built
1968
6770 Indian Creek Dr, Miami Beach, FL 33141
$-1,185
Cash flow
-19.4%
Cash-on-Cash Return
1.7%
Cap rate
0.8%
Rent to Value Ratio

$355,000
0
bds
|
1
ba
|
400
sqft
|
built
1966
5445 Collins Ave, Miami Beach, FL 33140
$-256
Cash flow
-3.8%
Cash-on-Cash Return
5.3%
Cap rate
0.8%
Rent to Value Ratio

$950,000
2
bds
|
2
ba
|
1,305
sqft
|
built
1980
2625 Collins Ave, Miami Beach, FL 33140
$-3,285
Cash flow
-18.0%
Cash-on-Cash Return
2.0%
Cap rate
0.5%
Rent to Value Ratio
$285,000
2
bds
|
2
ba
|
629
sqft
|
built
1925
1218 Drexel Ave, Miami Beach, FL 33139
$-426
Cash flow
-7.8%
Cash-on-Cash Return
4.4%
Cap rate
0.9%
Rent to Value Ratio
$1,570,000
2
bds
|
3
ba
|
1,428
sqft
|
built
2006
734 Michigan Ave, Miami Beach, FL 33139
$-4,548
Cash flow
-15.1%
Cash-on-Cash Return
2.7%
Cap rate
0.4%
Rent to Value Ratio
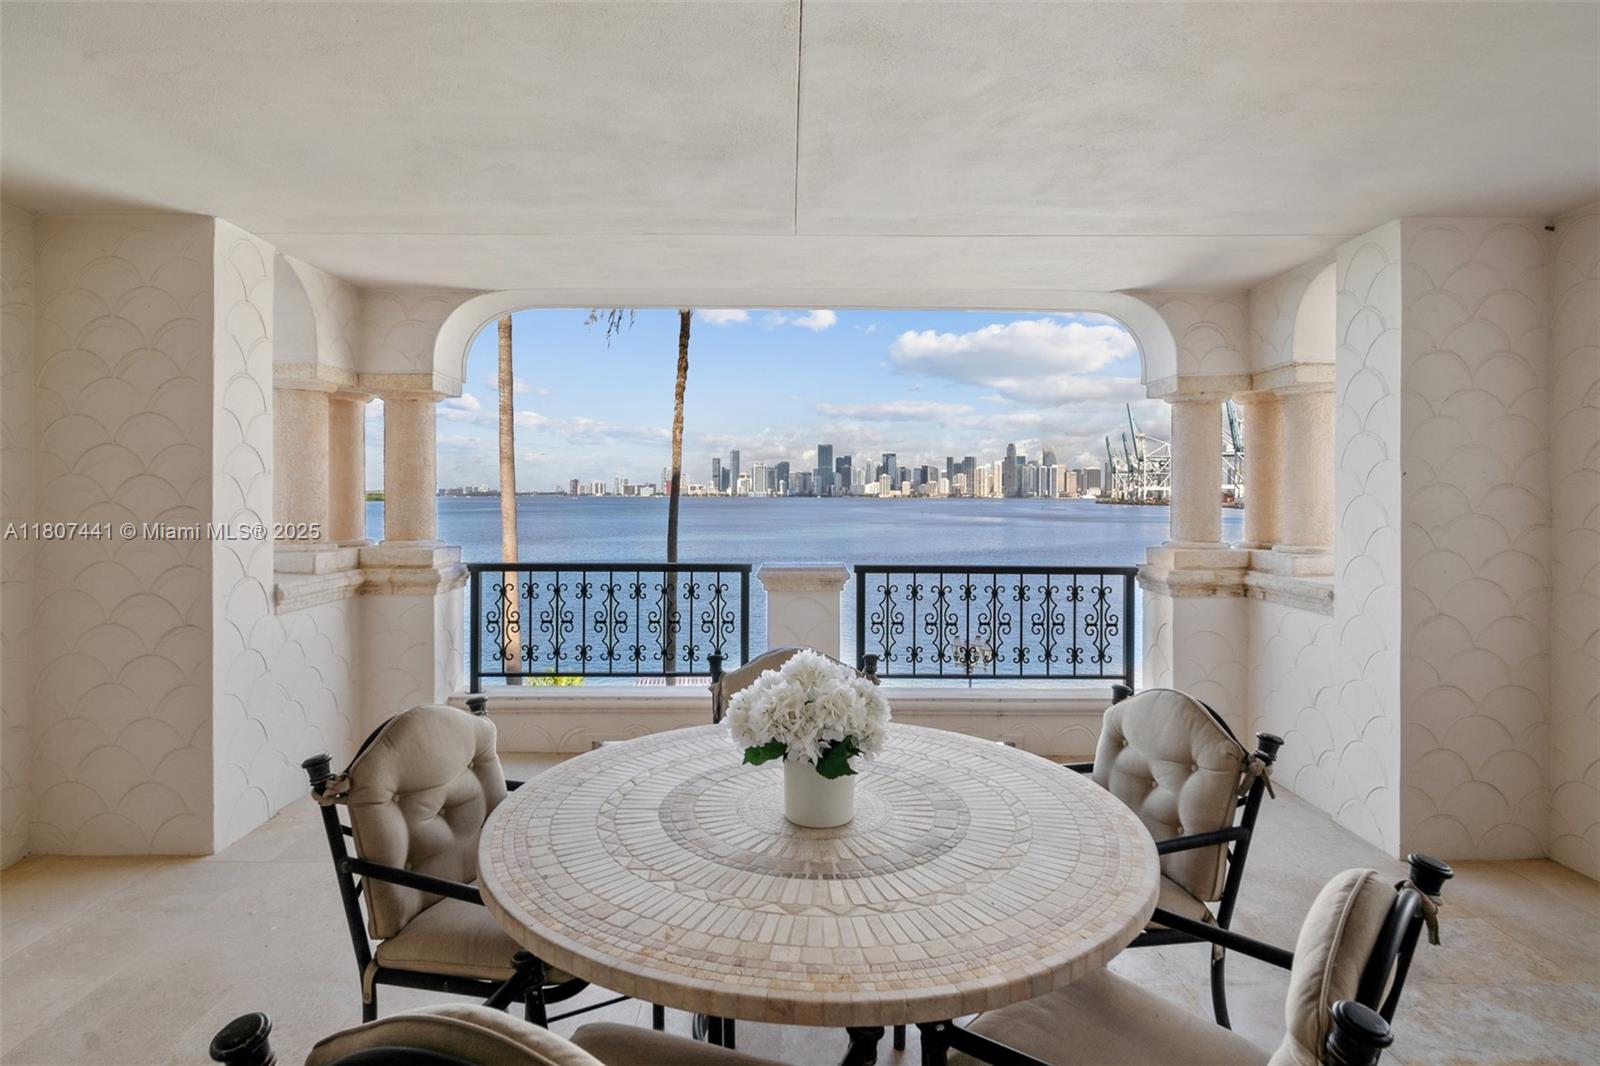
$3,890,000
2
bds
|
3
ba
|
1,950
sqft
|
built
1992
5235 Fisher Island Dr, Miami Beach, FL 33109
$-23,188
Cash flow
-31.1%
Cash-on-Cash Return
-1.0%
Cap rate
0.2%
Rent to Value Ratio
$230,000
2
bds
|
2
ba
|
855
sqft
|
built
1973
7900 Tatum Waterway Dr, Miami Beach, FL 33141
$-729
Cash flow
-16.5%
Cash-on-Cash Return
2.3%
Cap rate
0.9%
Rent to Value Ratio
$275,000
1
bds
|
1
ba
|
520
sqft
|
built
1925
1242 Drexel Ave, Miami Beach, FL 33139
$-810
Cash flow
-15.4%
Cash-on-Cash Return
2.6%
Cap rate
0.7%
Rent to Value Ratio
$10,895,000
4
bds
|
6
ba
|
4,473
sqft
|
built
2016
1825 Cleveland Rd, Miami Beach, FL 33141
$-55,978
Cash flow
-26.8%
Cash-on-Cash Return
0.0%
Cap rate
0.1%
Rent to Value Ratio
$2,100,000
1
bds
|
0
ba
|
0
sqft
|
built
1948
847 81st St, Miami Beach, FL 33141
$-12,037
Cash flow
-29.9%
Cash-on-Cash Return
-0.7%
Cap rate
0.1%
Rent to Value Ratio
$235,000
1
bds
|
1
ba
|
373
sqft
|
built
1925
1244 Pennsylvania Ave, Miami Beach, FL 33139
$-379
Cash flow
-8.4%
Cash-on-Cash Return
4.2%
Cap rate
0.9%
Rent to Value Ratio
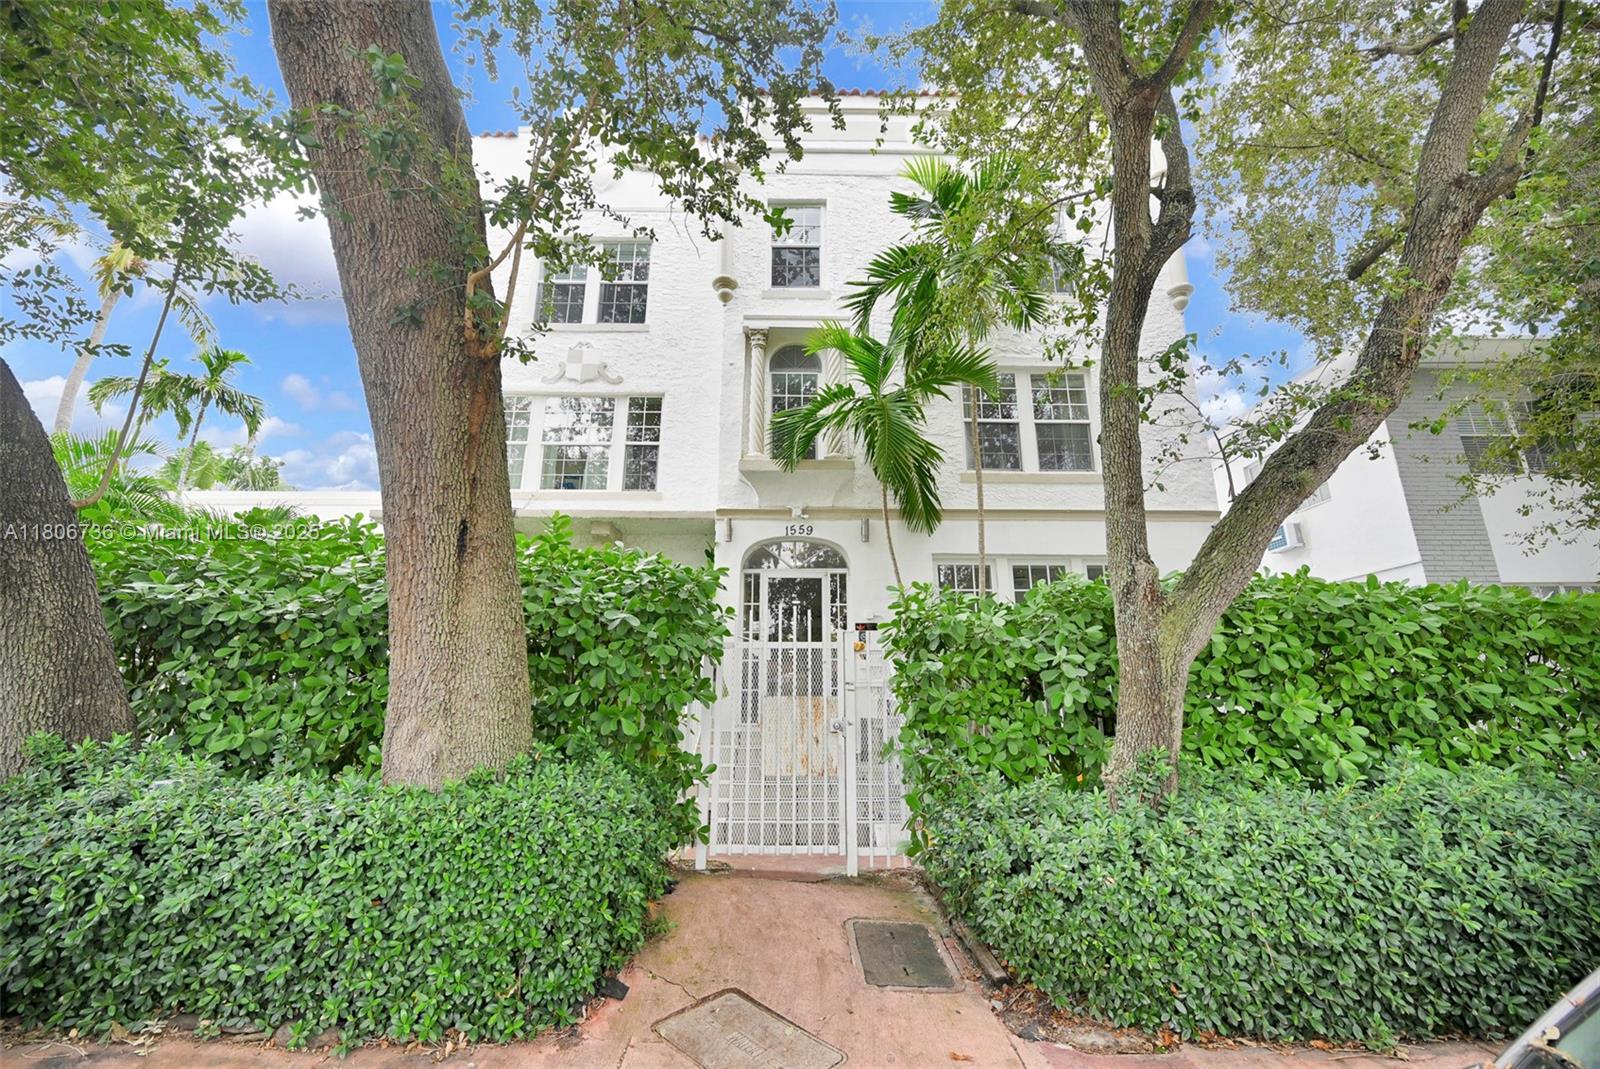
$352,999
2
bds
|
1
ba
|
691
sqft
|
built
1925
1559 Michigan Ave, Miami Beach, FL 33139
$-900
Cash flow
-13.3%
Cash-on-Cash Return
3.1%
Cap rate
0.8%
Rent to Value Ratio
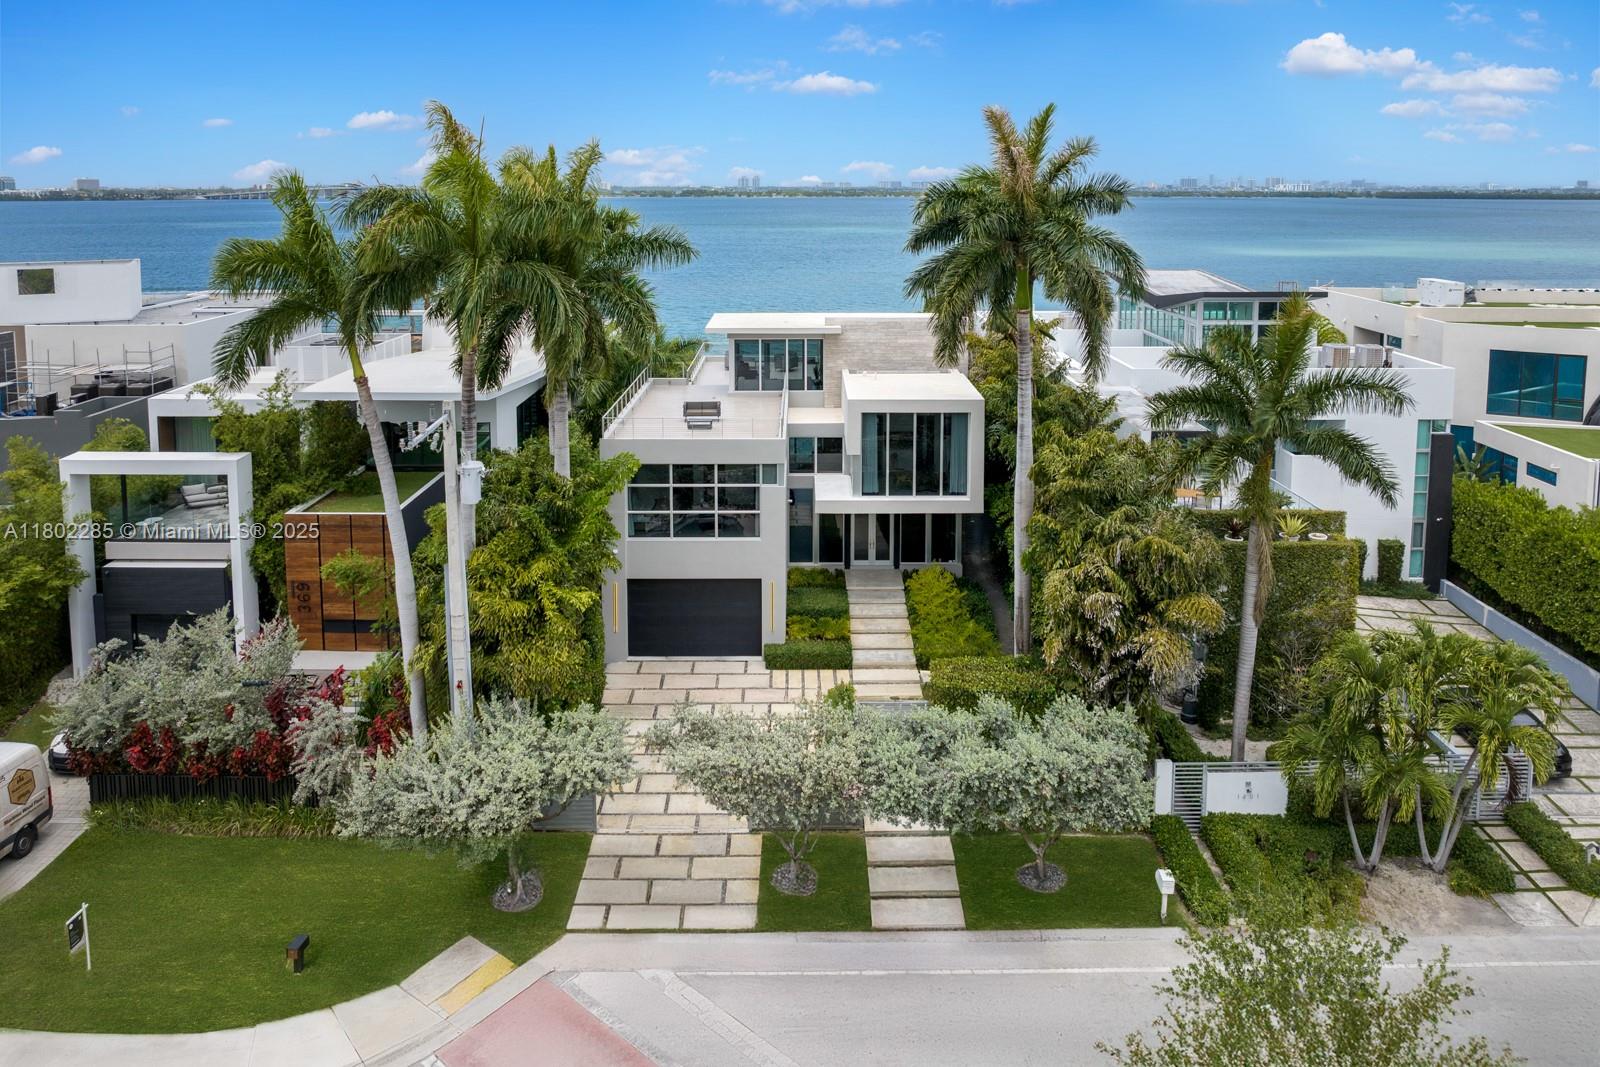
$6,250,000
3
bds
|
4
ba
|
4,185
sqft
|
built
2021
4700 N Meridian Ave, Miami Beach, FL 33140
n/a
Cash flow
n/a
Cash-on-Cash Return
n/a
Cap rate
n/a
Rent to Value Ratio
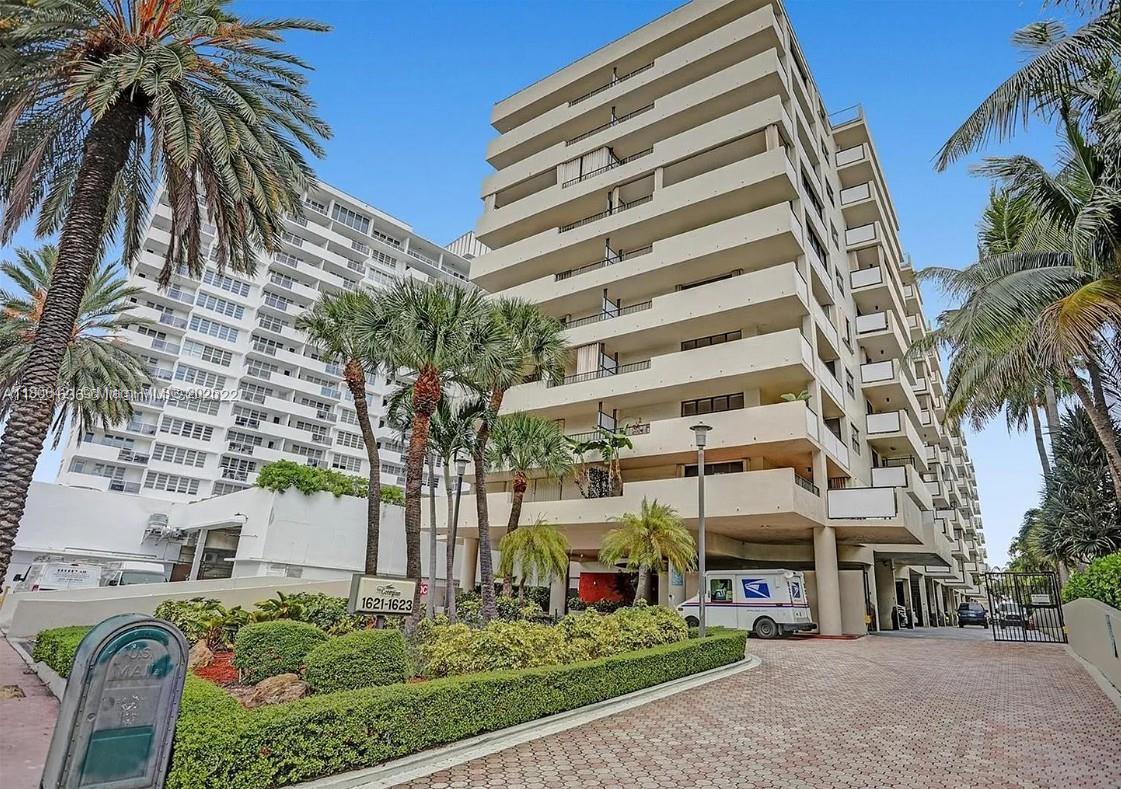
$675,000
2
bds
|
2
ba
|
874
sqft
|
built
1980
1621 Collins Ave, Miami Beach, FL 33139
$-2,182
Cash flow
-16.9%
Cash-on-Cash Return
2.3%
Cap rate
0.5%
Rent to Value Ratio
$3,950,000
3
bds
|
2
ba
|
2,328
sqft
|
built
1950
1241 Stillwater Dr, Miami Beach, FL 33141
$-15,091
Cash flow
-19.9%
Cash-on-Cash Return
1.6%
Cap rate
0.2%
Rent to Value Ratio

$419,000
1
bds
|
1
ba
|
826
sqft
|
built
1940
1025 Michigan Ave, Miami Beach, FL 33139
$-957
Cash flow
-11.9%
Cash-on-Cash Return
3.4%
Cap rate
0.8%
Rent to Value Ratio
$595,000
1
bds
|
1
ba
|
793
sqft
|
built
2001
1330 West Ave, Miami Beach, FL 33139
$-2,478
Cash flow
-21.7%
Cash-on-Cash Return
1.1%
Cap rate
0.5%
Rent to Value Ratio
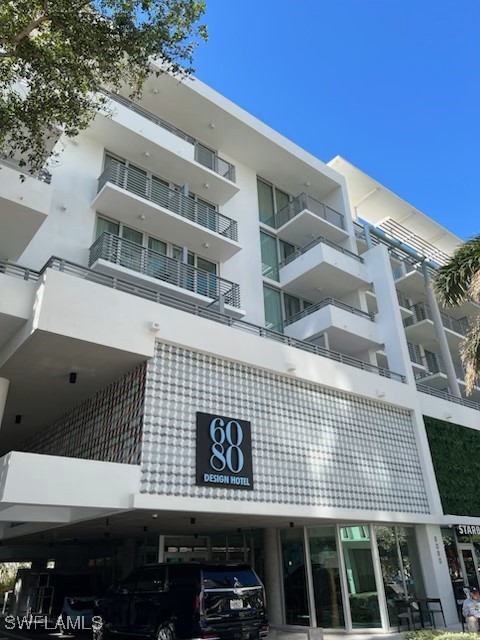
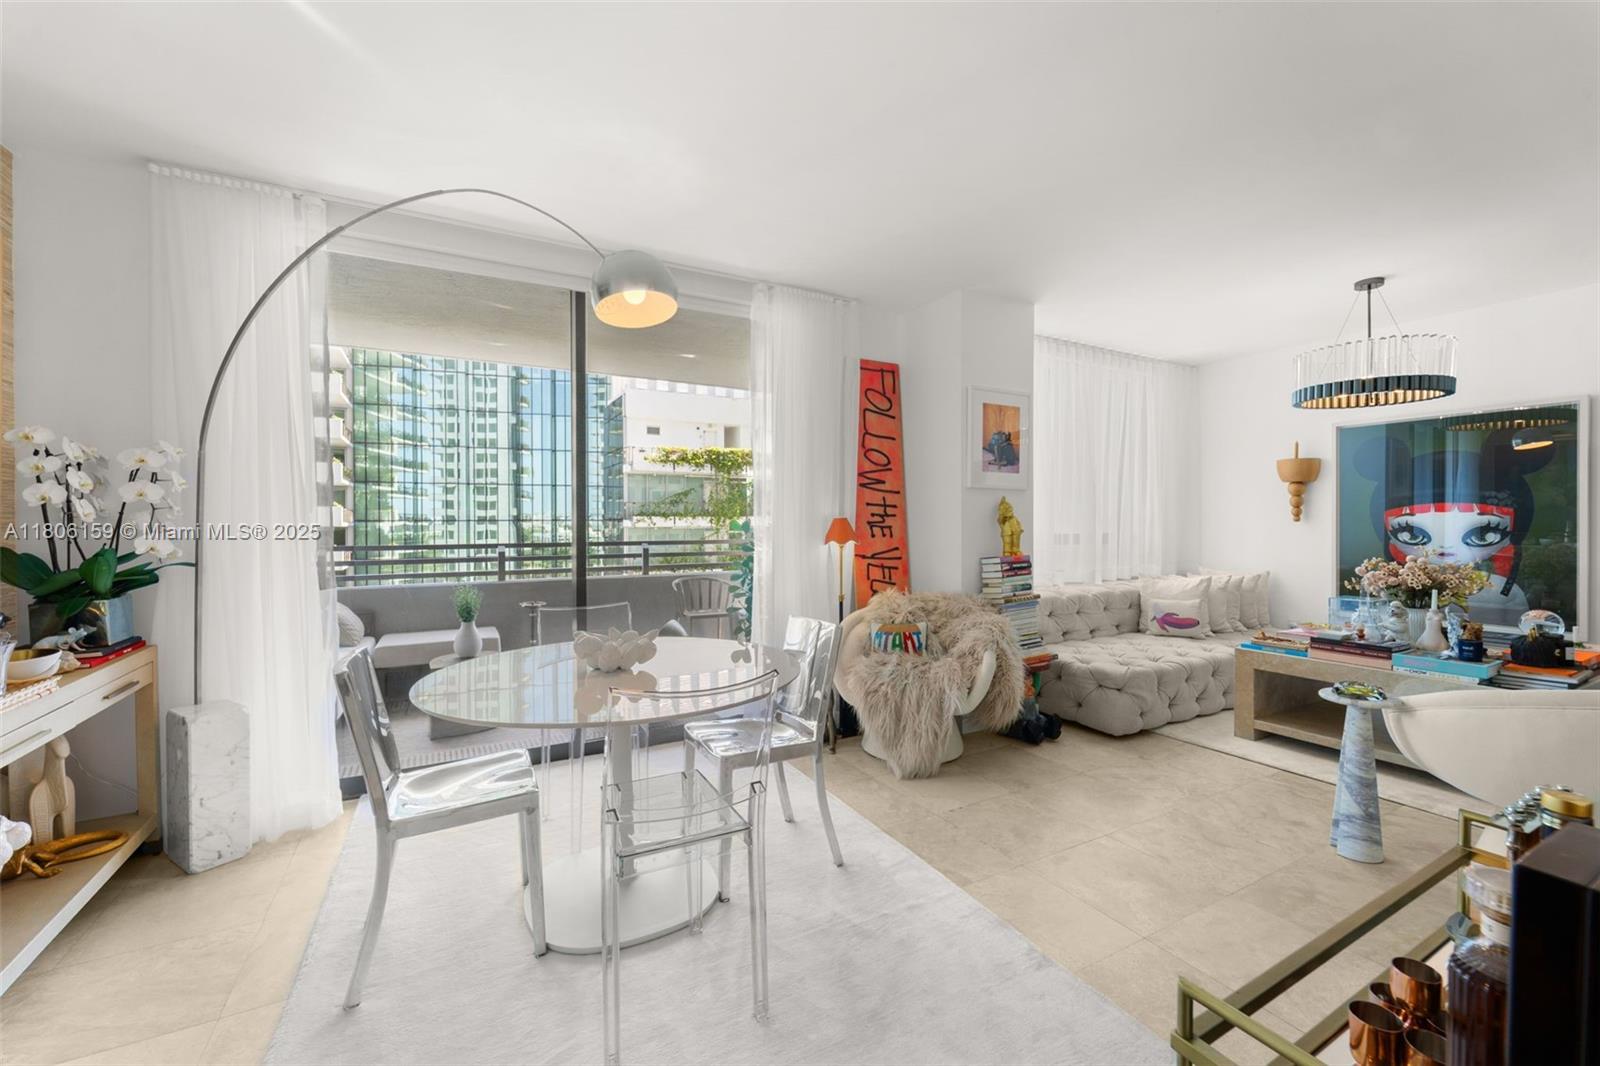
$295,000
1
bds
|
1
ba
|
331
sqft
|
built
2019
6080 Collins Ave, Miami Beach, FL 33140
$-616
Cash flow
-10.9%
Cash-on-Cash Return
3.6%
Cap rate
1.1%
Rent to Value Ratio
$550,000
2
bds
|
2
ba
|
1,935
sqft
|
built
1967
5640 Collins Ave, Miami Beach, FL 33140
$780
Cash flow
7.4%
Cash-on-Cash Return
7.8%
Cap rate
1.0%
Rent to Value Ratio
$1,499,000
2
bds
|
3
ba
|
2,534
sqft
|
built
1963
5255 Collins Ave, Miami Beach, FL 33140
$-9,358
Cash flow
-32.6%
Cash-on-Cash Return
-1.3%
Cap rate
0.3%
Rent to Value Ratio
$1,470,000
2
bds
|
2
ba
|
1,381
sqft
|
built
2006
734 Michigan Ave, Miami Beach, FL 33139
$-4,864
Cash flow
-17.3%
Cash-on-Cash Return
2.2%
Cap rate
0.4%
Rent to Value Ratio
$520,000
2
bds
|
2
ba
|
960
sqft
|
built
1962
5225 Collins Ave, Miami Beach, FL 33140
$-2,348
Cash flow
-23.6%
Cash-on-Cash Return
0.7%
Cap rate
0.8%
Rent to Value Ratio
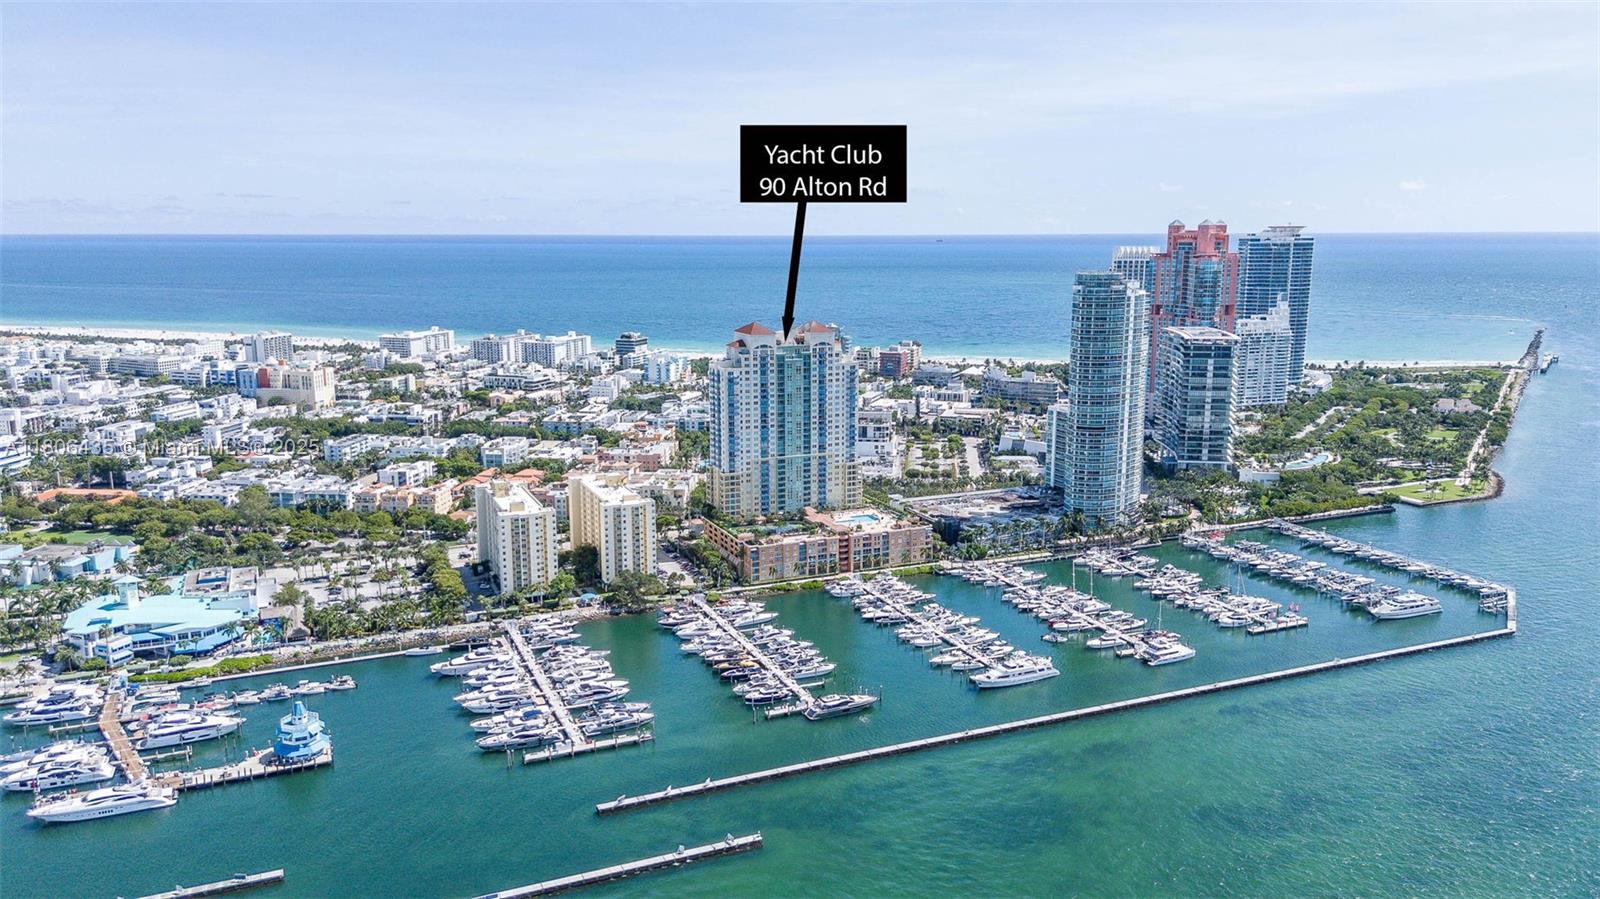
$950,000
2
bds
|
2
ba
|
1,080
sqft
|
built
1999
90 Alton Rd, Miami Beach, FL 33139
$-3,283
Cash flow
-18.0%
Cash-on-Cash Return
2.0%
Cap rate
0.7%
Rent to Value Ratio
$339,000
1
bds
|
1
ba
|
680
sqft
|
built
1967
4011 N Meridian Ave, Miami Beach, FL 33140
$-924
Cash flow
-14.2%
Cash-on-Cash Return
2.9%
Cap rate
0.7%
Rent to Value Ratio
$895,000
3
bds
|
2
ba
|
1,645
sqft
|
built
1975
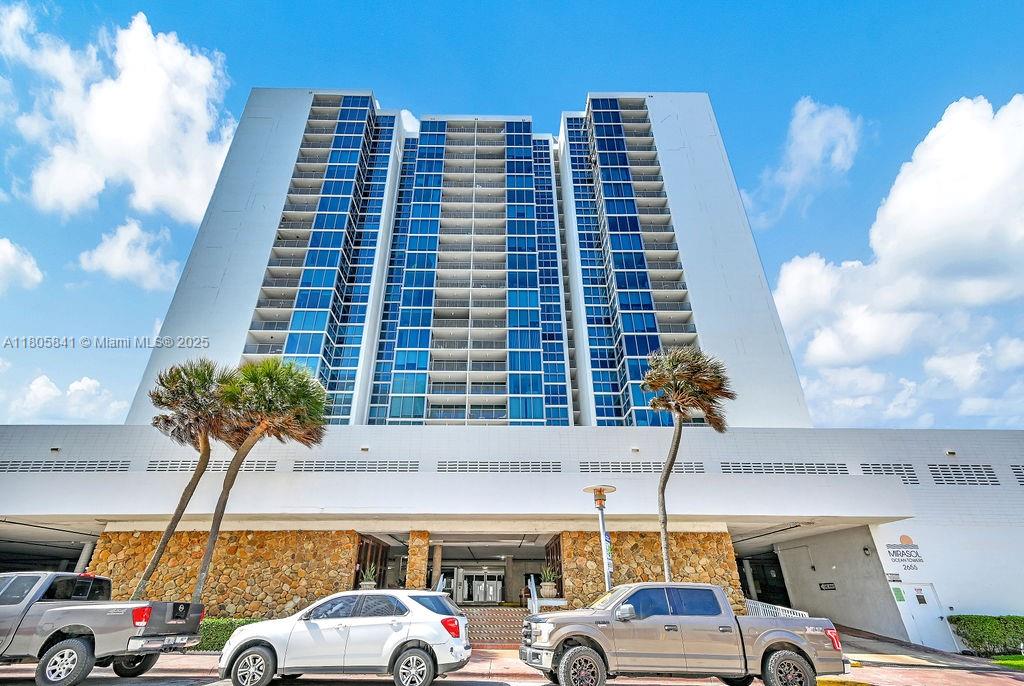
2655 Collins Ave, Miami Beach, FL 33140
$-3,171
Cash flow
-18.5%
Cash-on-Cash Return
1.9%
Cap rate
0.6%
Rent to Value Ratio
$990,000
2
bds
|
3
ba
|
2,210
sqft
|
built
1970
5660 Collins Ave, Miami Beach, FL 33140
$-3,755
Cash flow
-19.8%
Cash-on-Cash Return
1.6%
Cap rate
0.7%
Rent to Value Ratio
$250,000
0
bds
|
1
ba
|
400
sqft
|
built
1947
1611 Euclid Ave, Miami Beach, FL 33139
$-492
Cash flow
-10.3%
Cash-on-Cash Return
3.8%
Cap rate
0.8%
Rent to Value Ratio

$1,849,900
6
bds
|
0
ba
|
2,668
sqft
|
built
1946
7411 Carlyle Ave, Miami Beach, FL 33141
$-9,602
Cash flow
-27.1%
Cash-on-Cash Return
-0.1%
Cap rate
0.1%
Rent to Value Ratio
$295,000
1
bds
|
1
ba
|
380
sqft
|
built
1960
75 Washington Ave, Miami Beach, FL 33139
$-920
Cash flow
-16.3%
Cash-on-Cash Return
2.4%
Cap rate
0.7%
Rent to Value Ratio
$2,425,000
2
bds
|
3
ba
|
1,334
sqft
|
built
2016
1201 20th St, Miami Beach, FL 33139
$-12,096
Cash flow
-26.0%
Cash-on-Cash Return
0.2%
Cap rate
0.3%
Rent to Value Ratio