Indianapolis, IN Investment Properties for Sale
Browse homes for sale and investment properties in Indianapolis, IN. Refine your search by price, property type, or more.
Best cash flowing properties in Indianapolis, IN
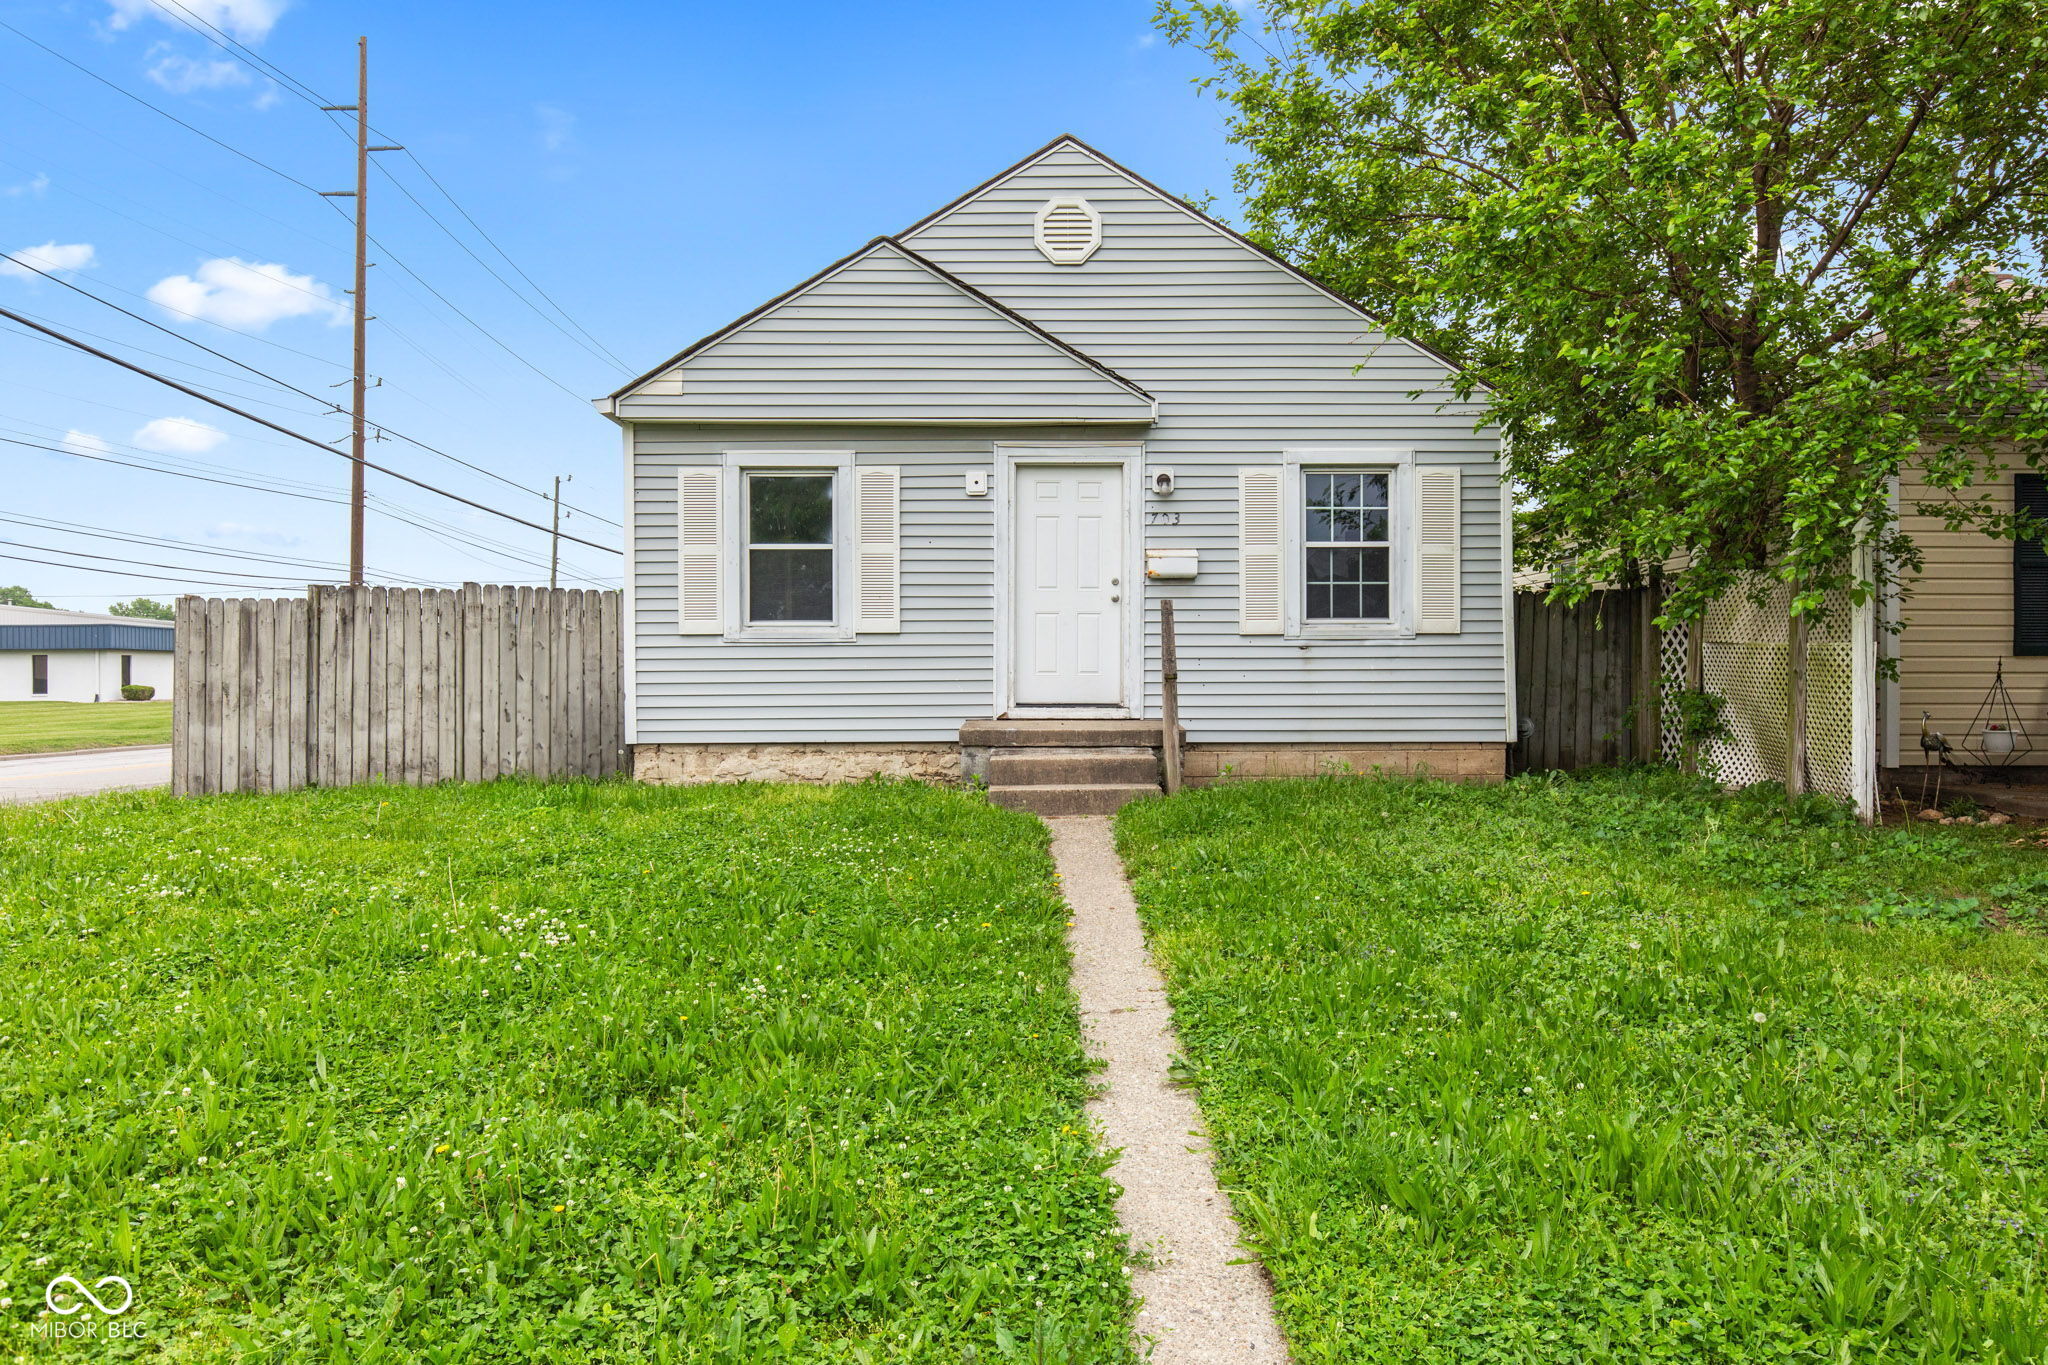
$129,900
2
bds
|
1
ba
|
870
sqft
|
built
1940
703 Kappes St, Indianapolis, IN 46221
$301
Cash flow
12.1%
Cash-on-Cash Return
8.9%
Cap rate
1.1%
Rent to Value Ratio
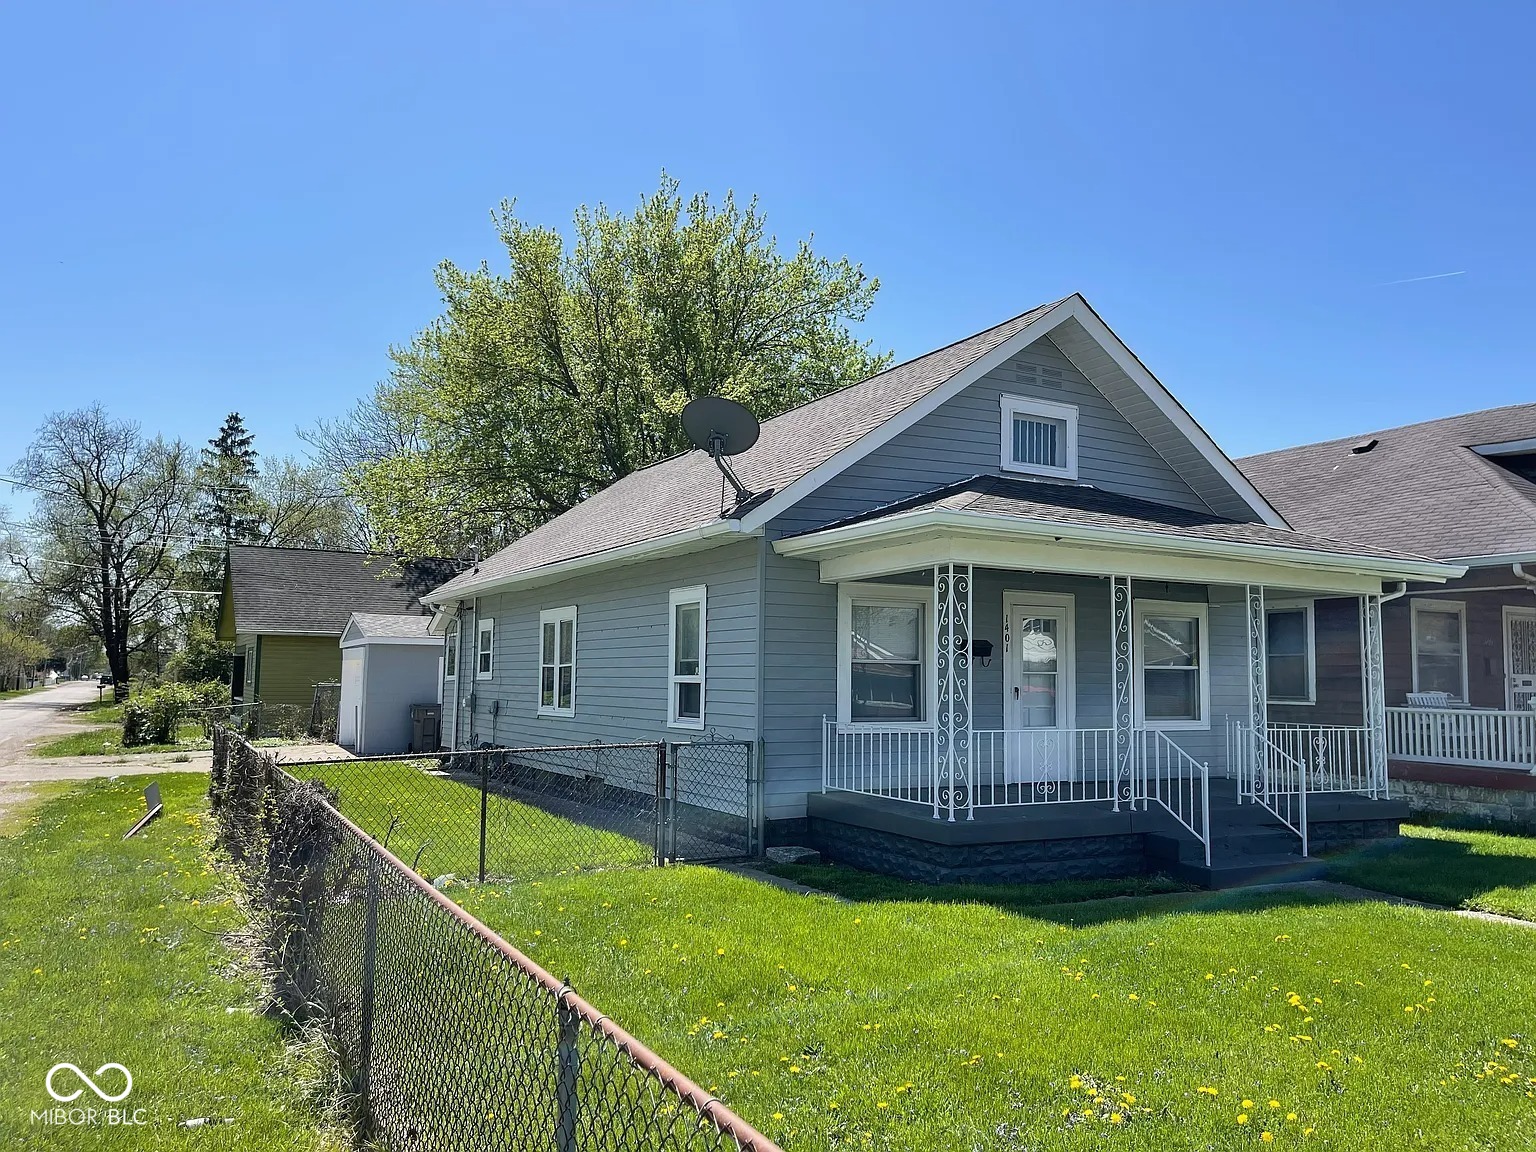
$142,000
2
bds
|
1
ba
|
960
sqft
|
built
1930
1401 W 34th St, Indianapolis, IN 46208
$239
Cash flow
8.8%
Cash-on-Cash Return
8.2%
Cap rate
1.0%
Rent to Value Ratio
1,681 out of 1,992 properties for sale in Indianapolis, IN
Limited Results Shown
Create a free account, or log in to reveal all property listings and enjoy the complete experience.

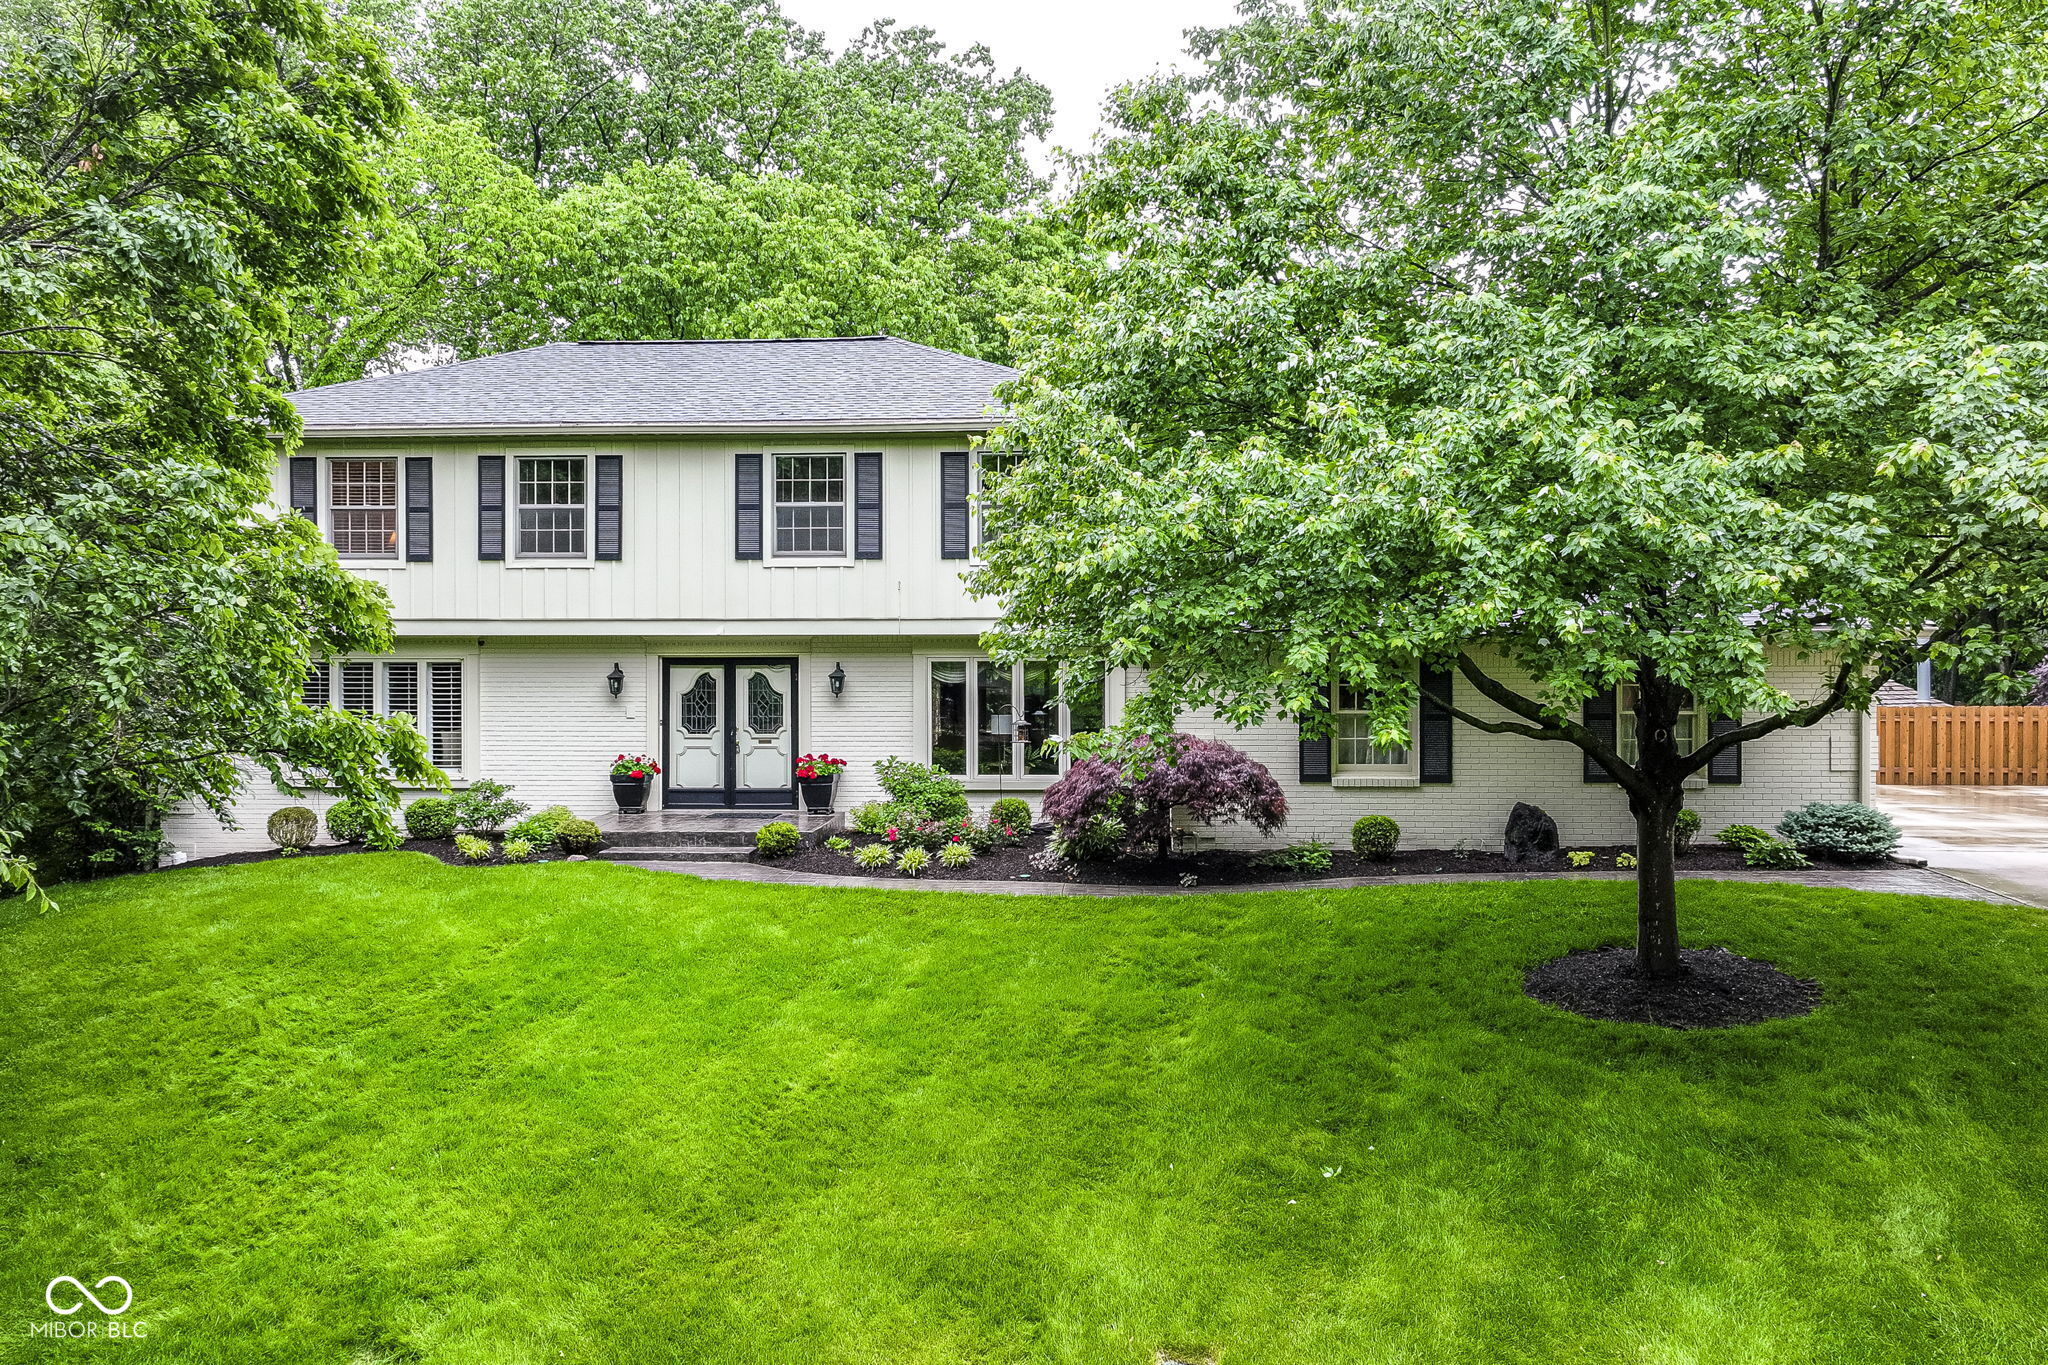
$550,000
3
bds
|
3
ba
|
3,138
sqft
|
built
1978
8330 Claridge Rd, Indianapolis, IN 46260
$-686
Cash flow
-6.5%
Cash-on-Cash Return
4.6%
Cap rate
0.6%
Rent to Value Ratio
$674,900
5
bds
|
4
ba
|
3,972
sqft
|
built
1965
6530 Lowanna Way, Indianapolis, IN 46220
$-1,732
Cash flow
-13.4%
Cash-on-Cash Return
3.1%
Cap rate
0.4%
Rent to Value Ratio
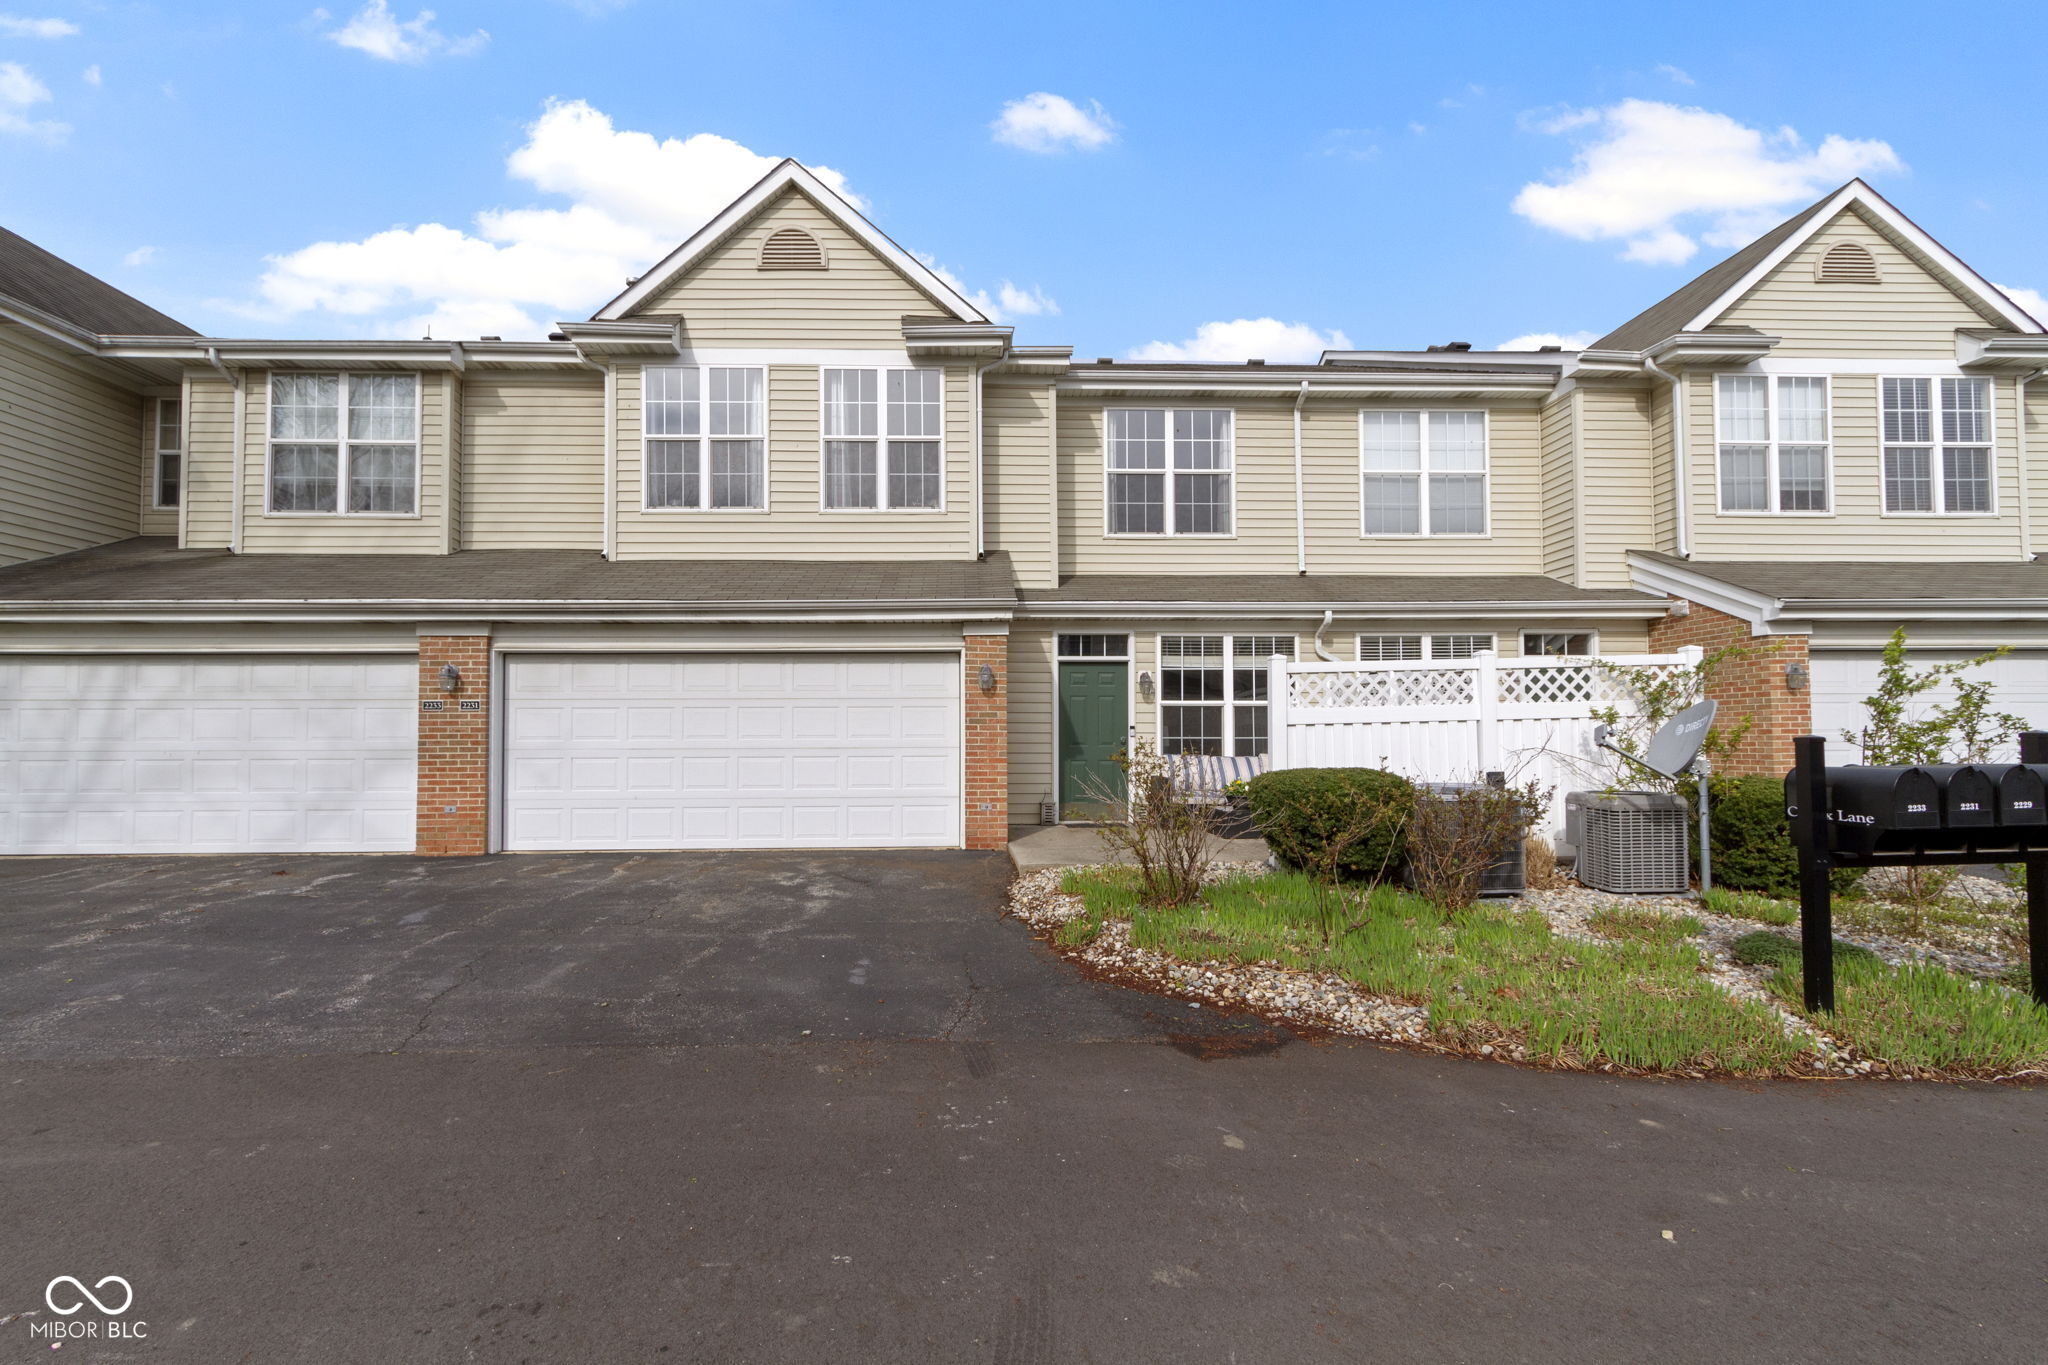
$225,000
2
bds
|
3
ba
|
1,448
sqft
|
built
2003
2231 Colfax Ln, Indianapolis, IN 46260
$-206
Cash flow
-4.8%
Cash-on-Cash Return
5.1%
Cap rate
0.8%
Rent to Value Ratio
$255,000
2
bds
|
3
ba
|
1,558
sqft
|
built
1997
7548 Briarstone Dr, Indianapolis, IN 46227
$-304
Cash flow
-6.2%
Cash-on-Cash Return
4.7%
Cap rate
0.7%
Rent to Value Ratio
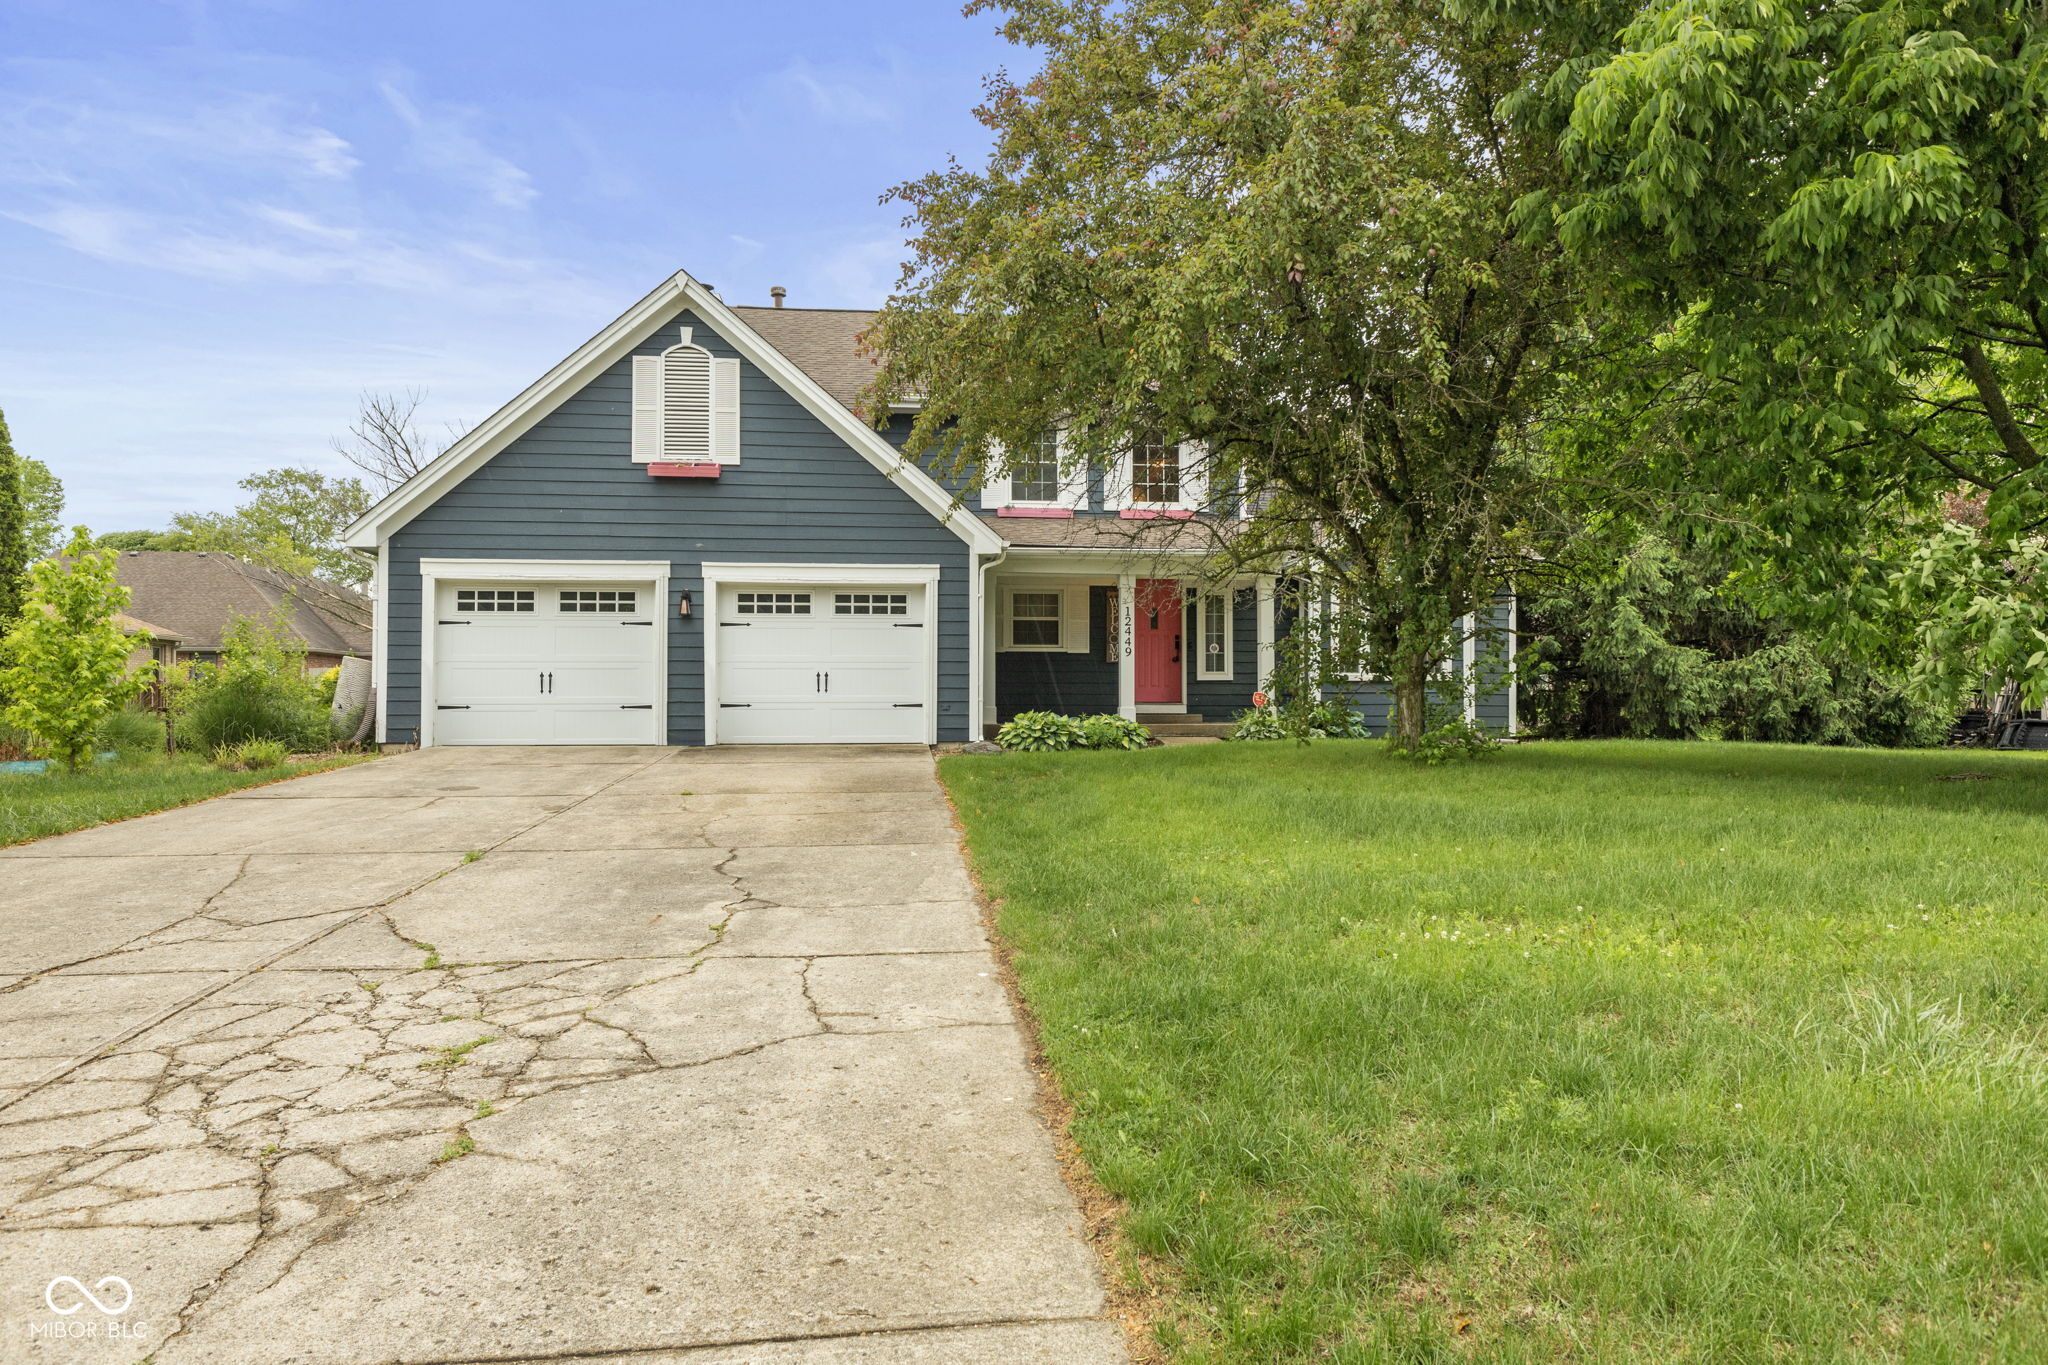
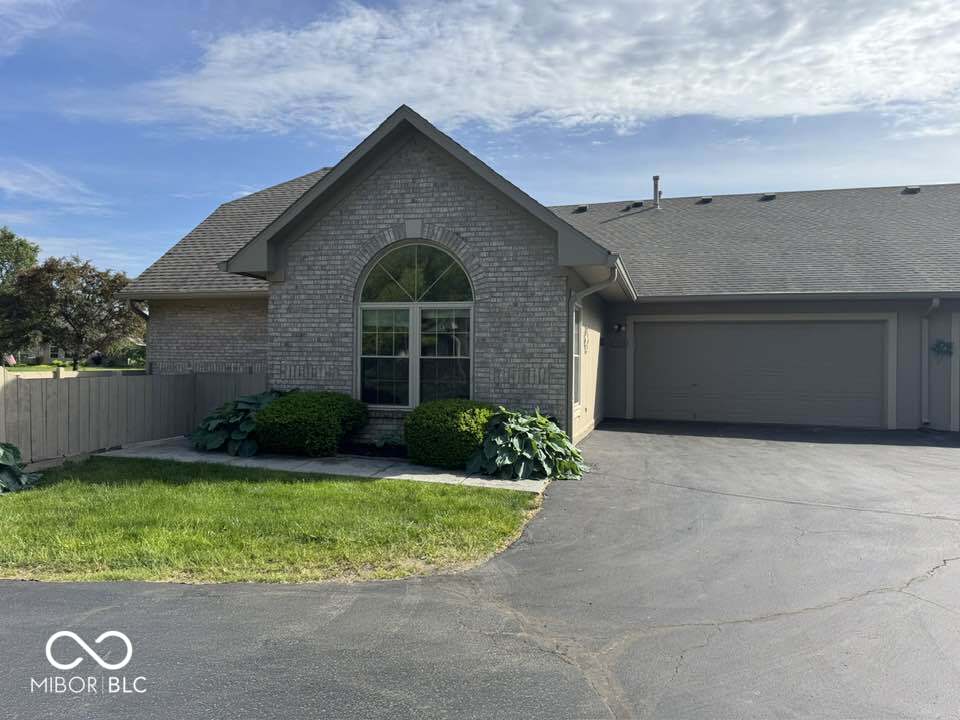
$330,000
4
bds
|
3
ba
|
2,249
sqft
|
built
1989
12449 Huntington Dr, Indianapolis, IN 46229
$-105
Cash flow
-1.7%
Cash-on-Cash Return
5.8%
Cap rate
0.7%
Rent to Value Ratio
$160,000
3
bds
|
2
ba
|
1,611
sqft
|
built
1987
4336 Abby Creek Ln, Indianapolis, IN 46205
$159
Cash flow
5.2%
Cash-on-Cash Return
7.3%
Cap rate
1.0%
Rent to Value Ratio
$200,000
3
bds
|
1
ba
|
1,722
sqft
|
built
1910
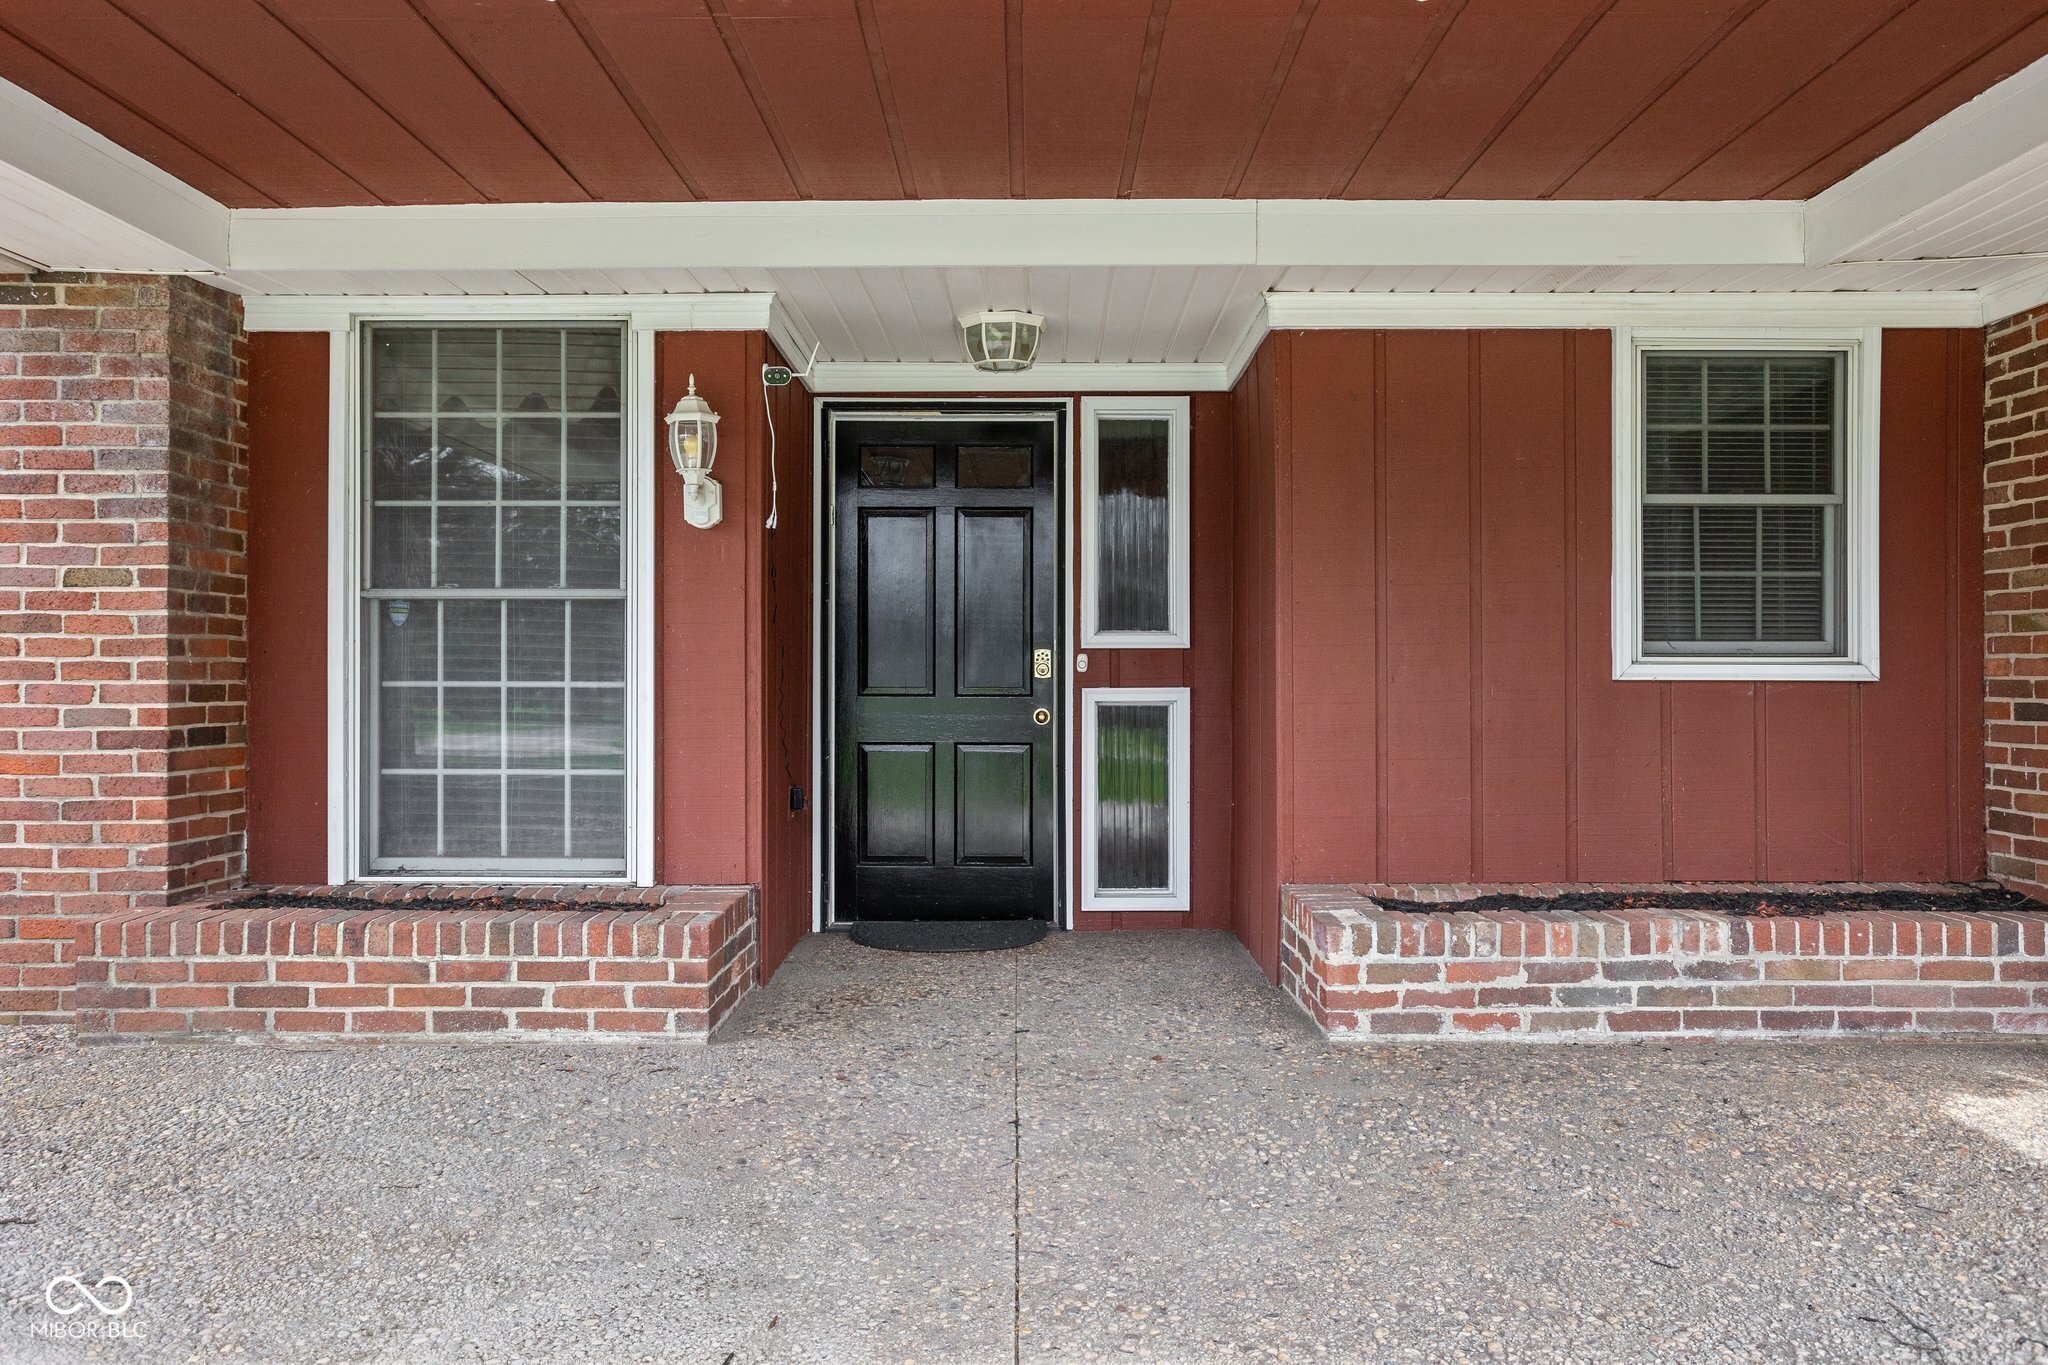
853 S Belleview Pl, Indianapolis, IN 46221
$80
Cash flow
2.1%
Cash-on-Cash Return
6.6%
Cap rate
0.8%
Rent to Value Ratio
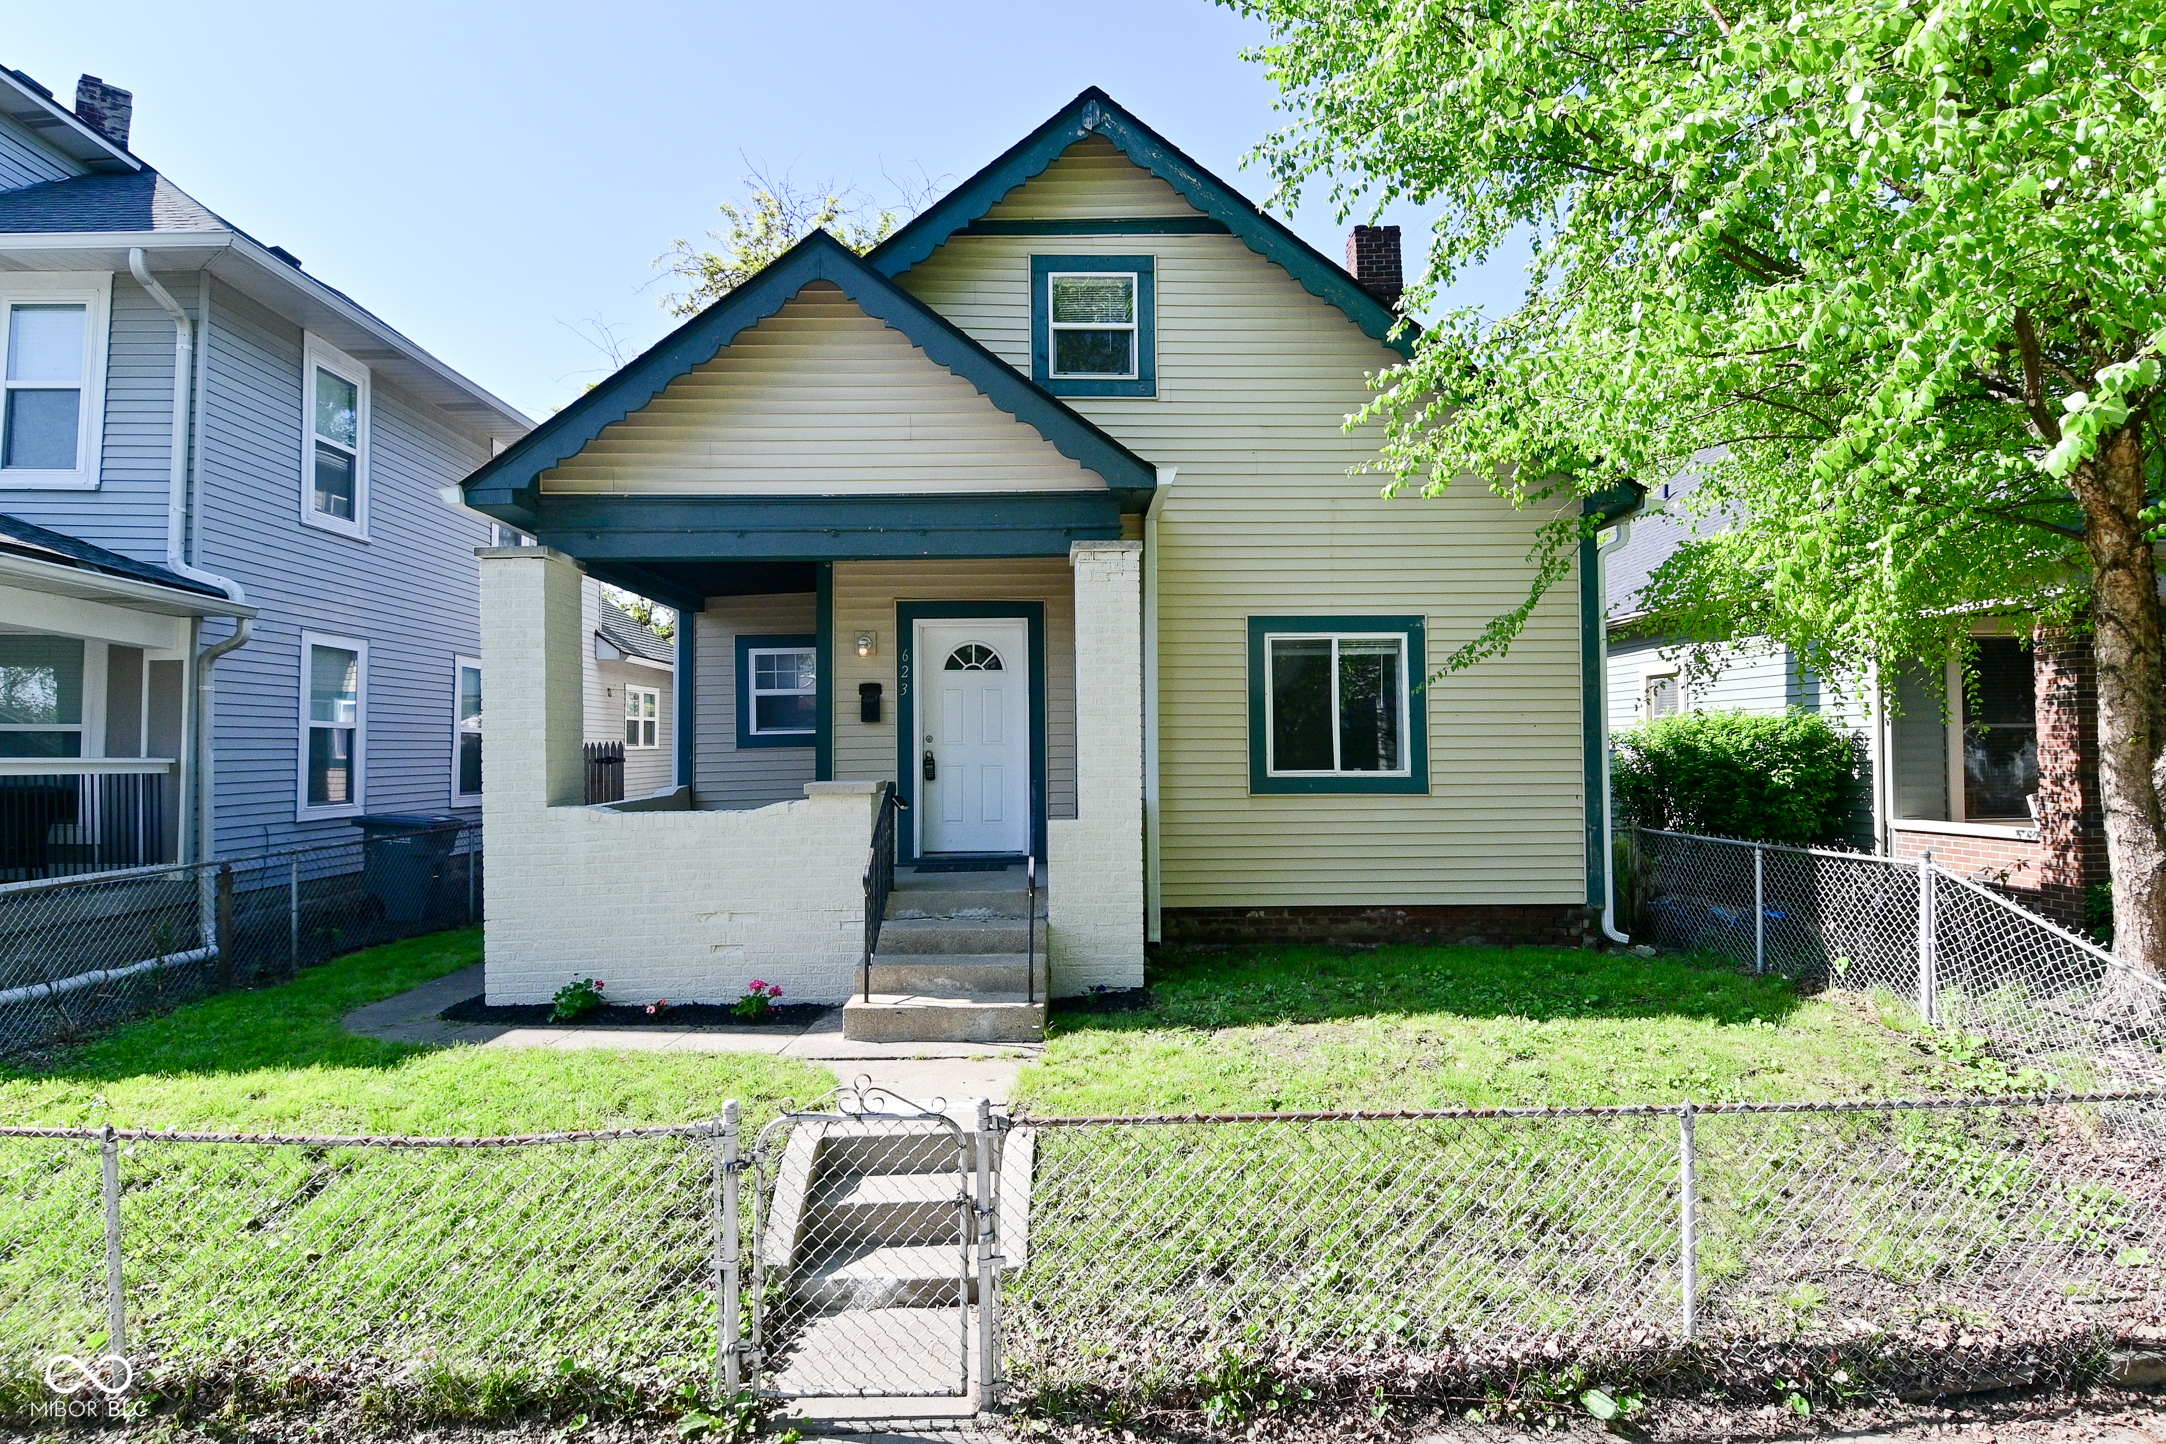
$279,900
4
bds
|
3
ba
|
1,582
sqft
|
built
1904
623 Orange St, Indianapolis, IN 46203
$-54
Cash flow
-1.0%
Cash-on-Cash Return
5.9%
Cap rate
0.7%
Rent to Value Ratio
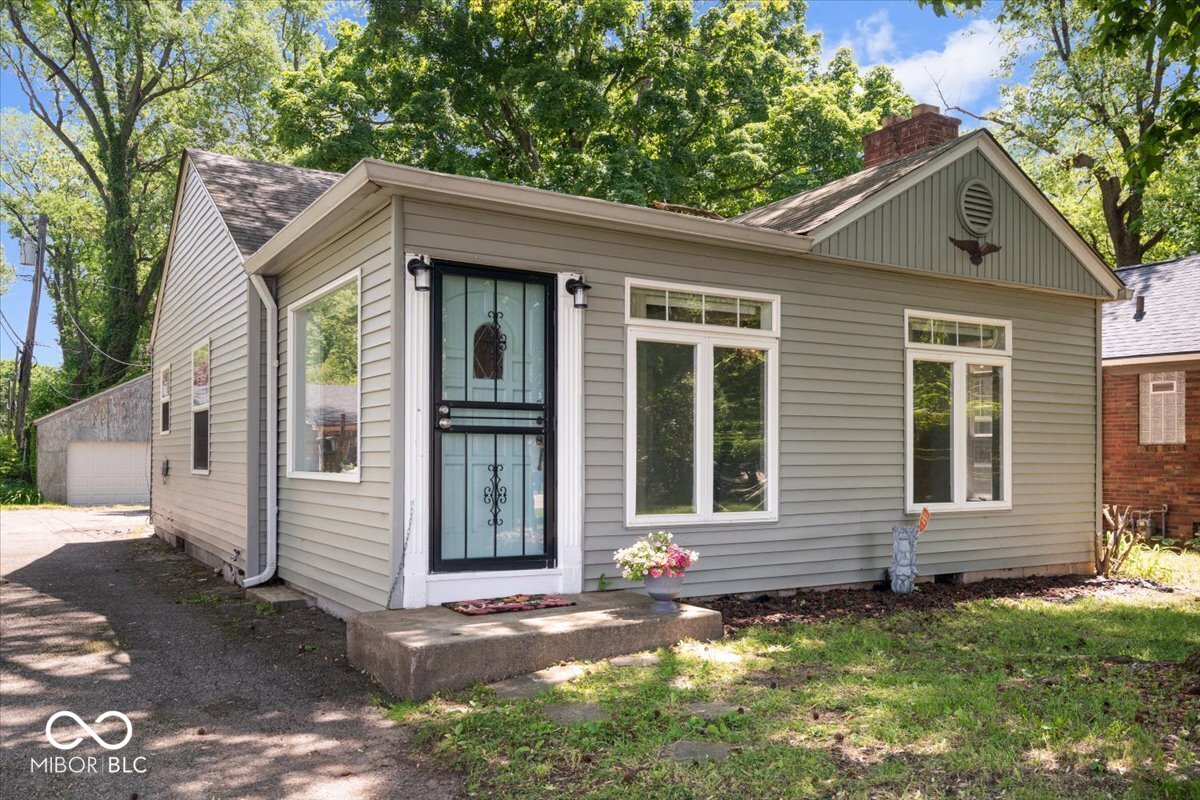
$250,000
2
bds
|
1
ba
|
1,128
sqft
|
built
1944
4809 Allisonville Rd, Indianapolis, IN 46205
$-177
Cash flow
-3.7%
Cash-on-Cash Return
5.3%
Cap rate
0.6%
Rent to Value Ratio

$298,000
4
bds
|
0
ba
|
0
sqft
|
built
1917
3837 Carrollton Ave, Indianapolis, IN 46205
$-630
Cash flow
-11.0%
Cash-on-Cash Return
3.6%
Cap rate
0.4%
Rent to Value Ratio
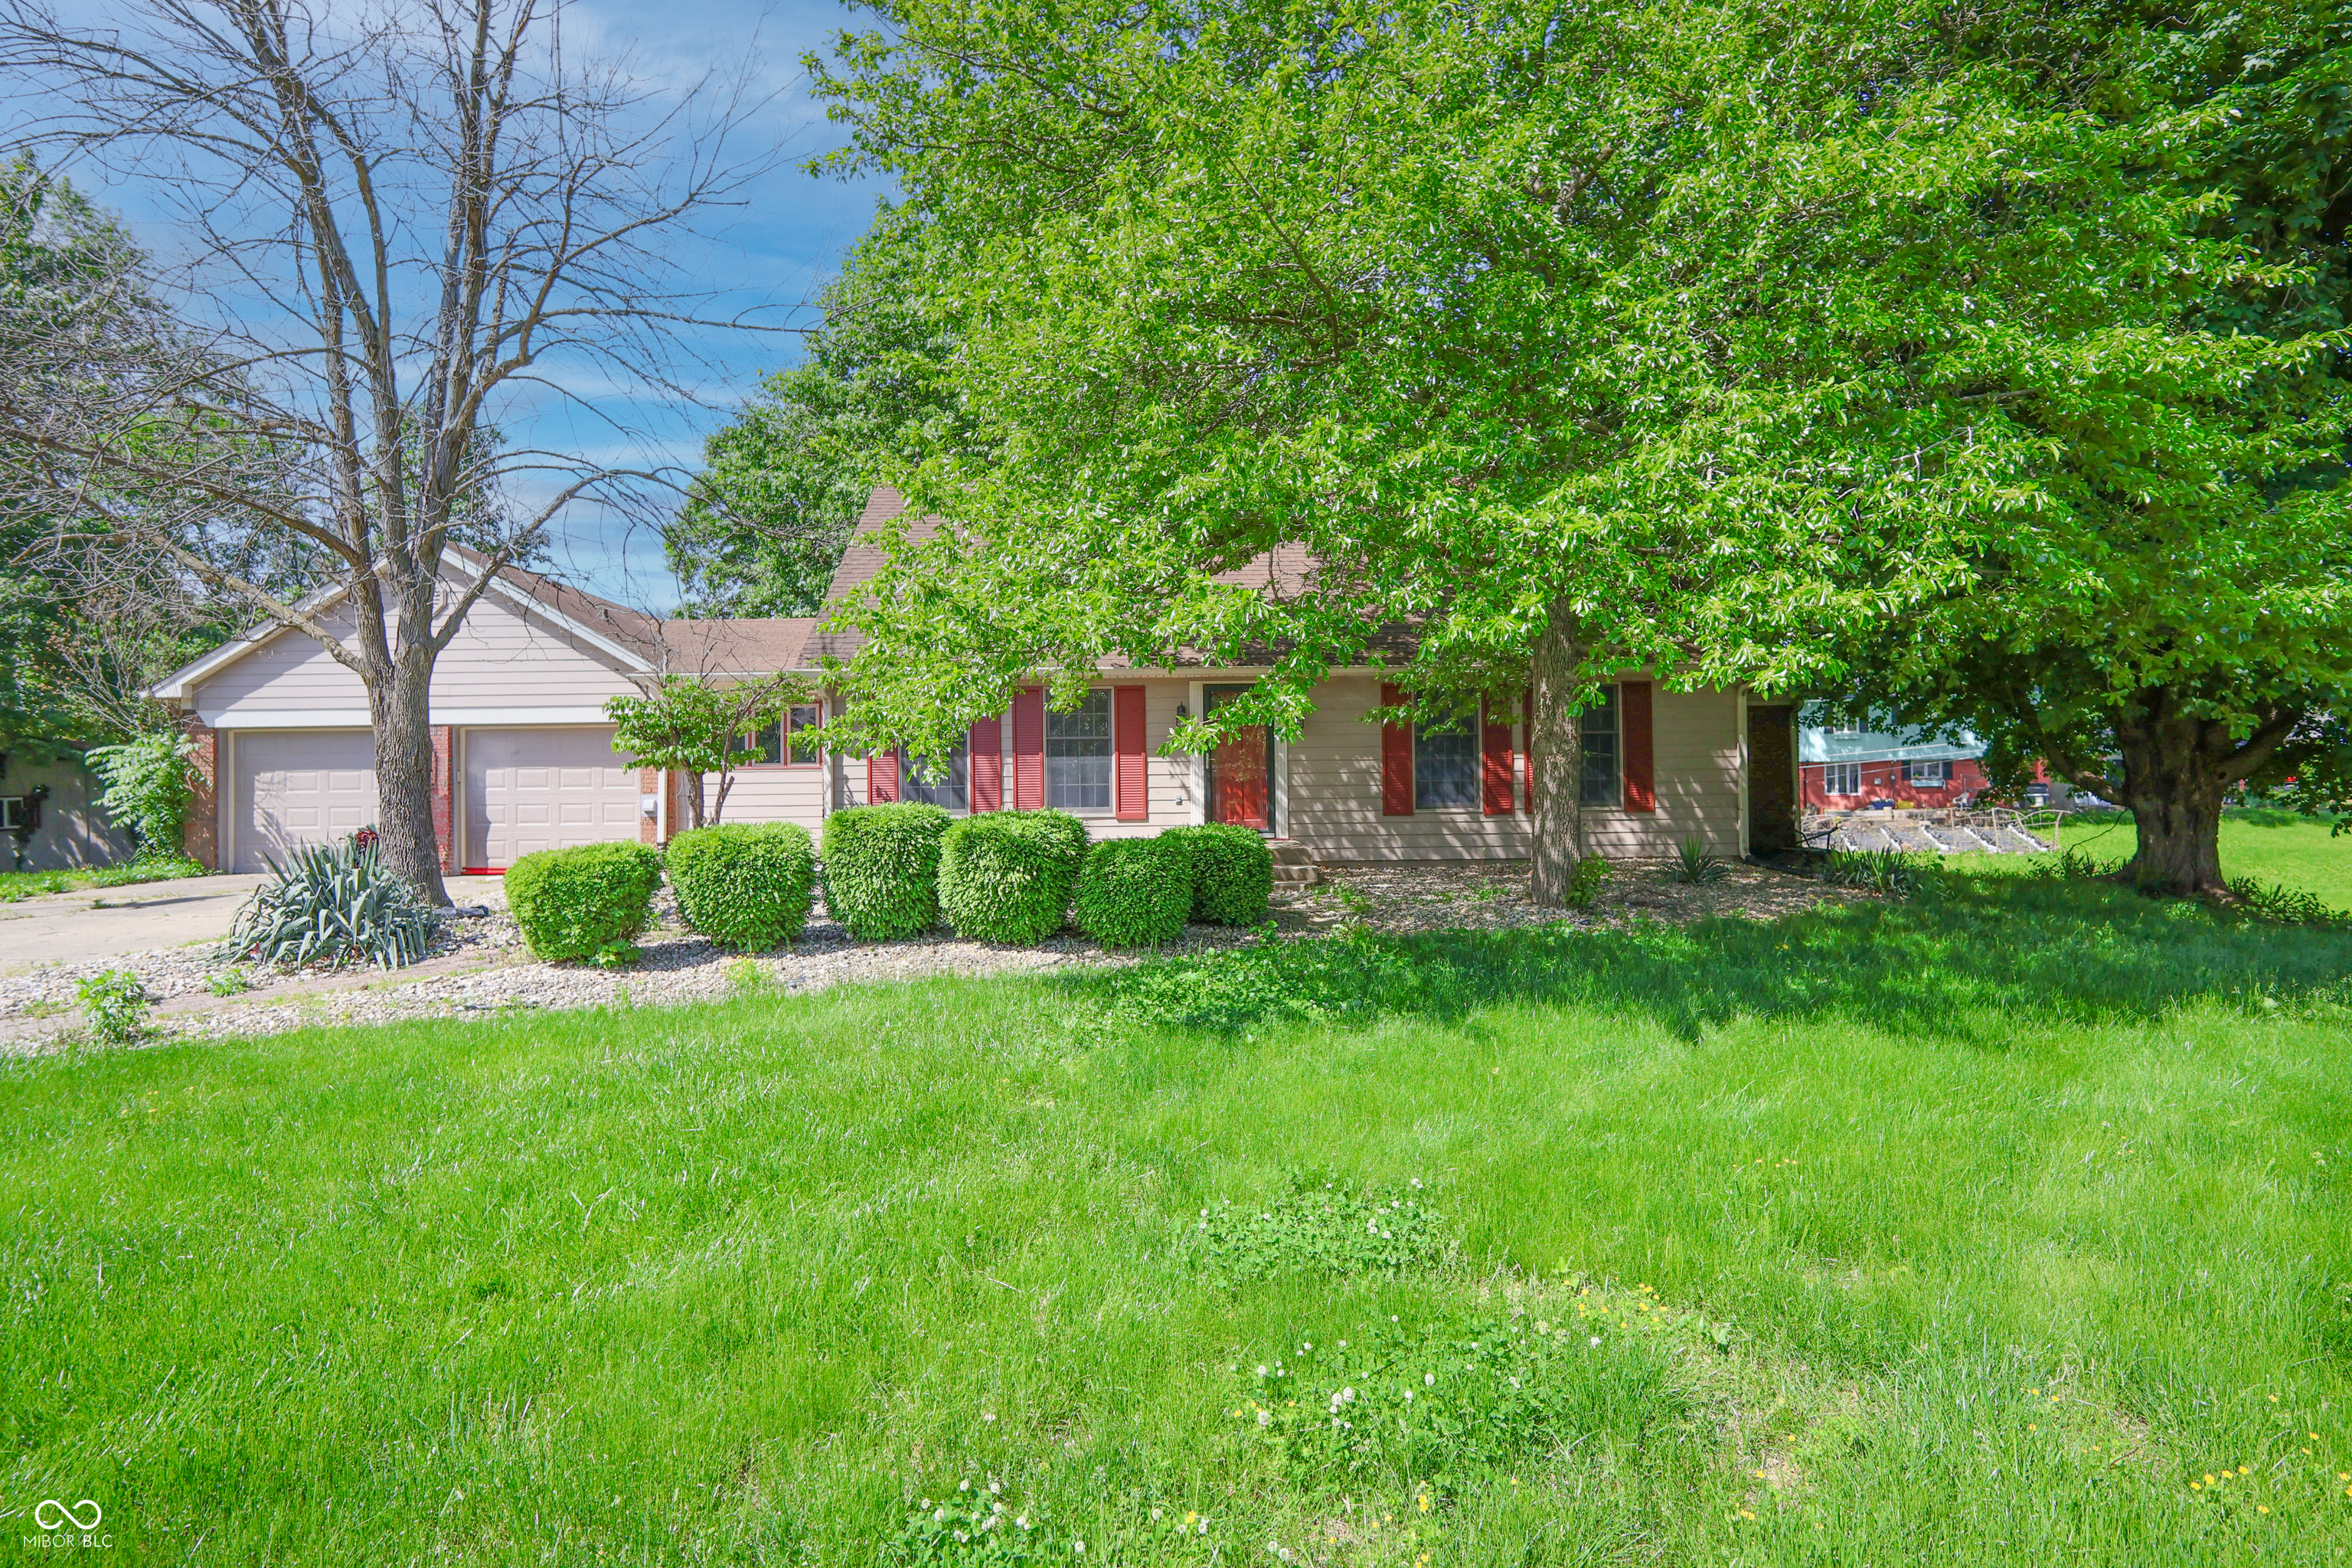
$350,000
5
bds
|
4
ba
|
3,931
sqft
|
built
1969
6334 Teak Ct, Indianapolis, IN 46217
$-68
Cash flow
-1.0%
Cash-on-Cash Return
5.9%
Cap rate
0.7%
Rent to Value Ratio
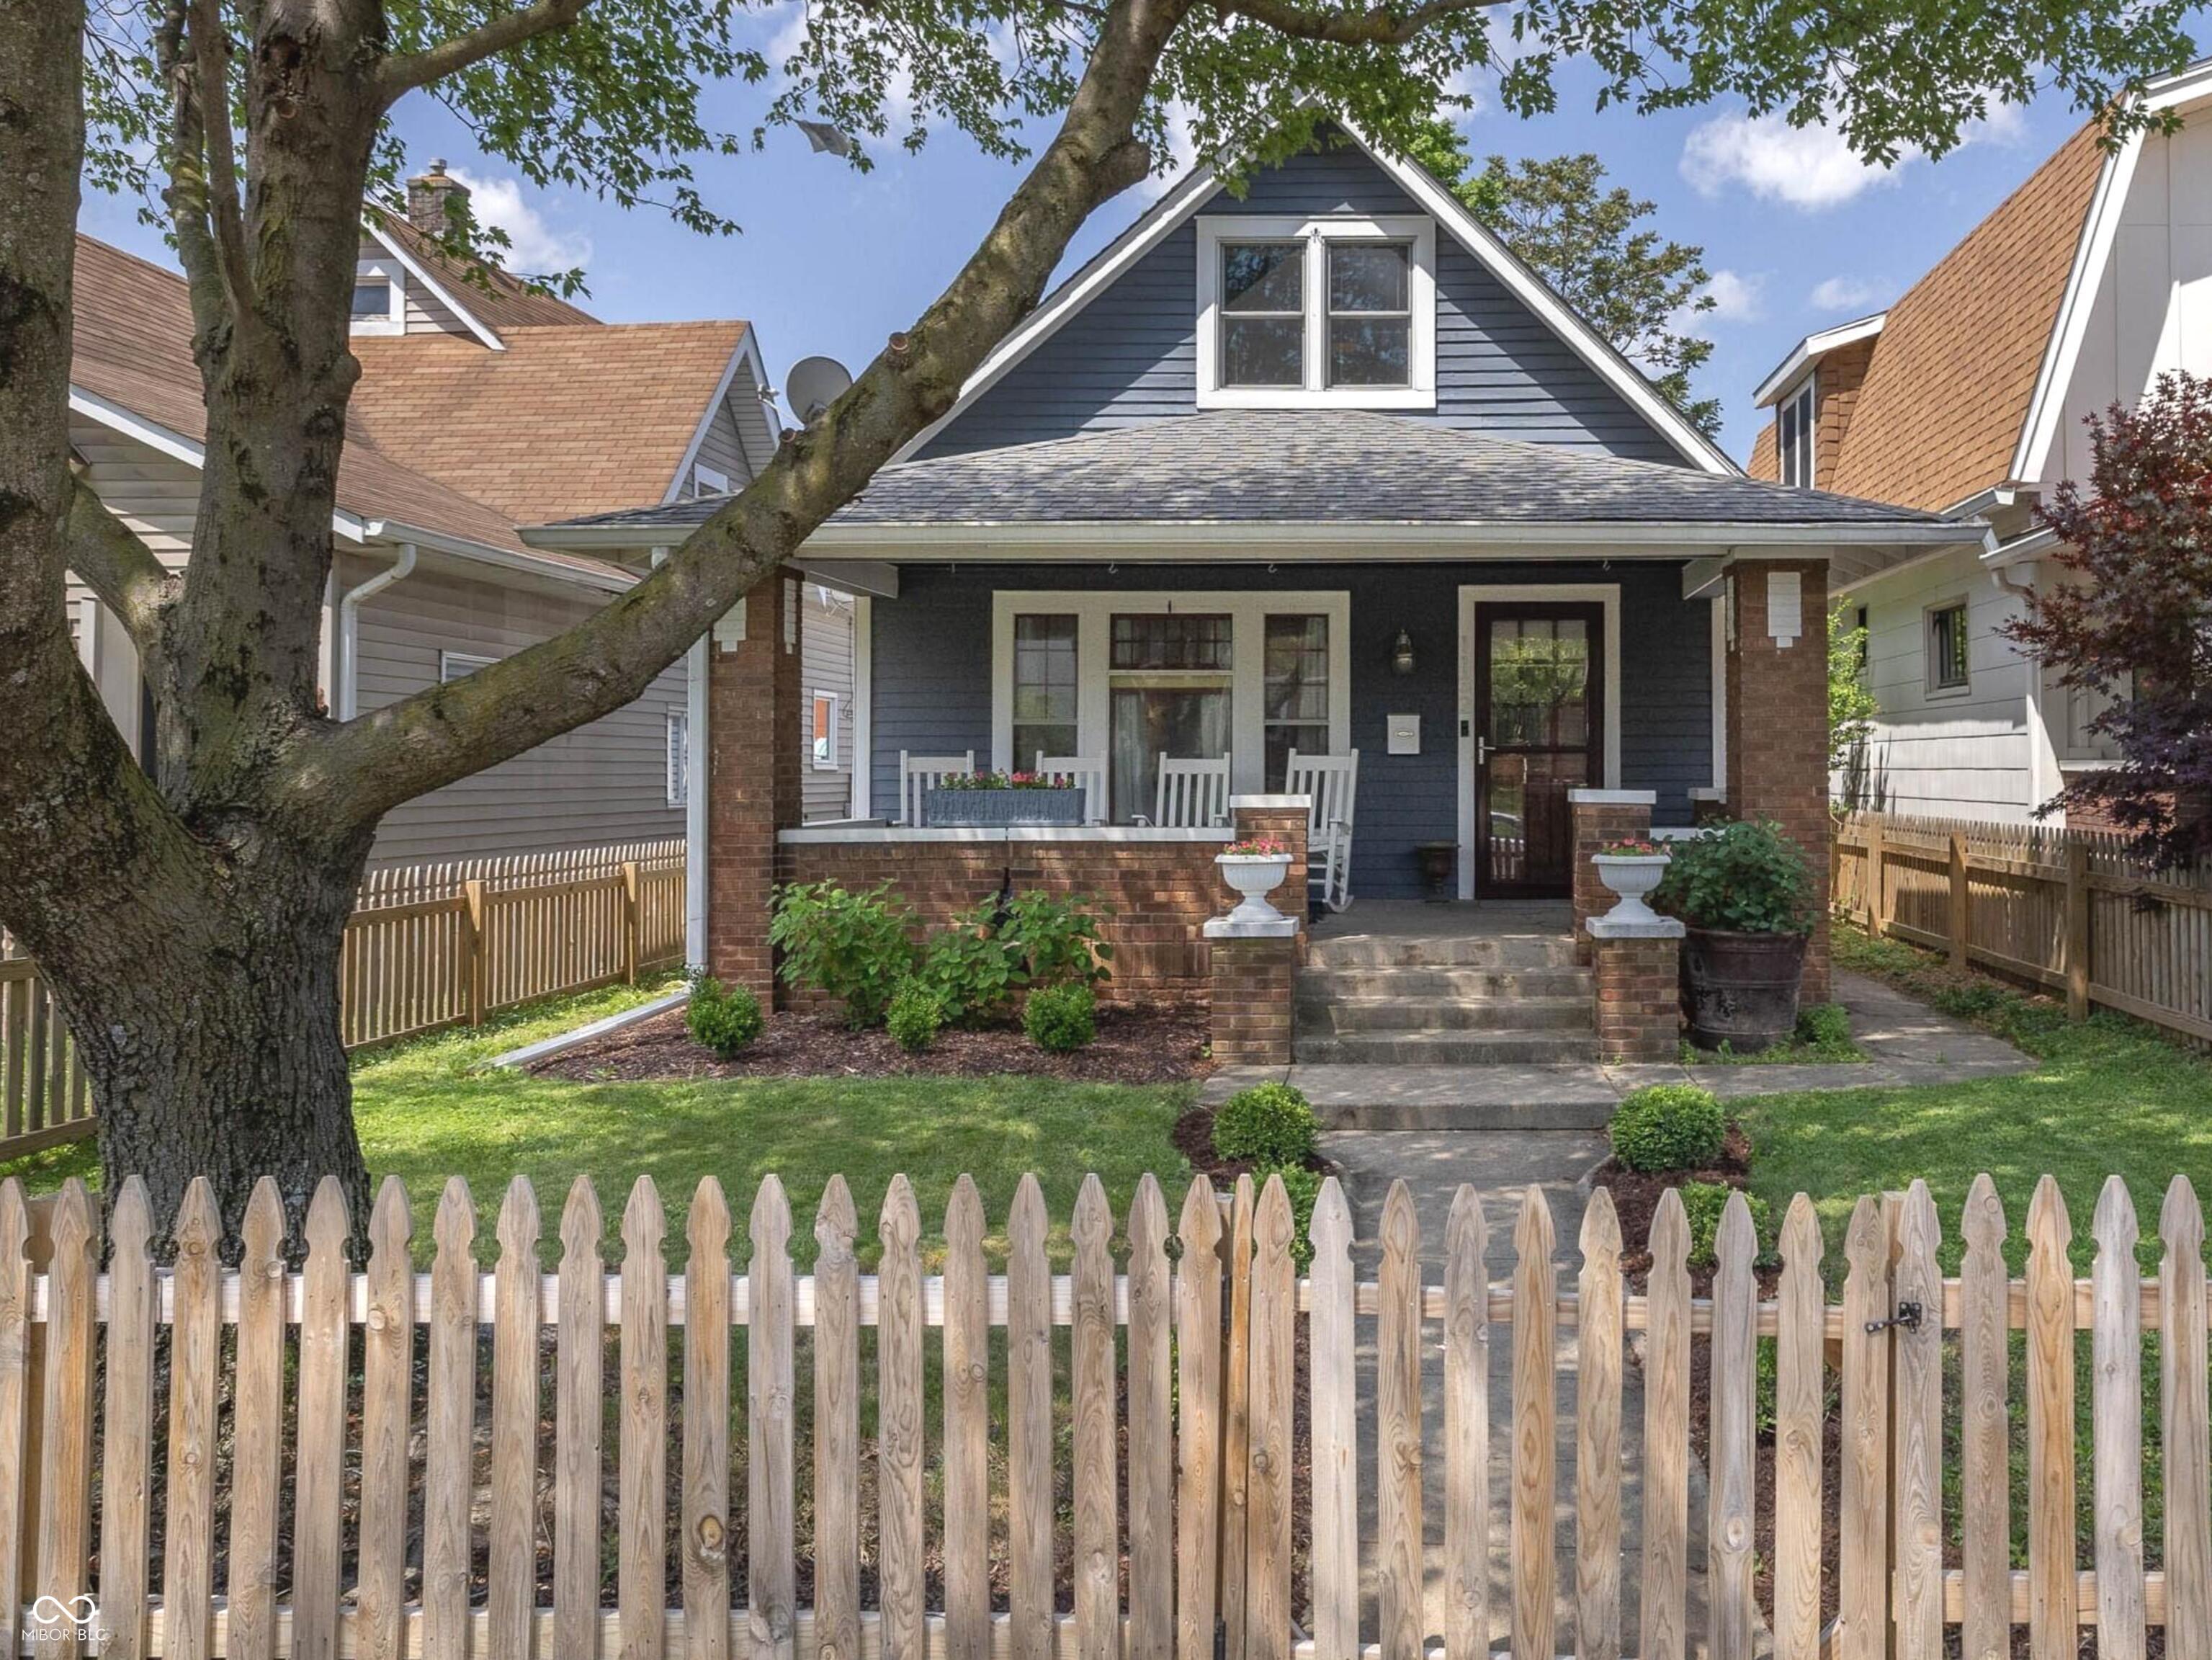
$410,000
4
bds
|
2
ba
|
2,015
sqft
|
built
1921
1132 Evison St, Indianapolis, IN 46203
$-168
Cash flow
-2.1%
Cash-on-Cash Return
5.7%
Cap rate
0.7%
Rent to Value Ratio
$129,900
2
bds
|
1
ba
|
870
sqft
|
built
1940
703 Kappes St, Indianapolis, IN 46221
$301
Cash flow
12.1%
Cash-on-Cash Return
8.9%
Cap rate
1.1%
Rent to Value Ratio
$900,000
4
bds
|
3
ba
|
2,184
sqft
|
built
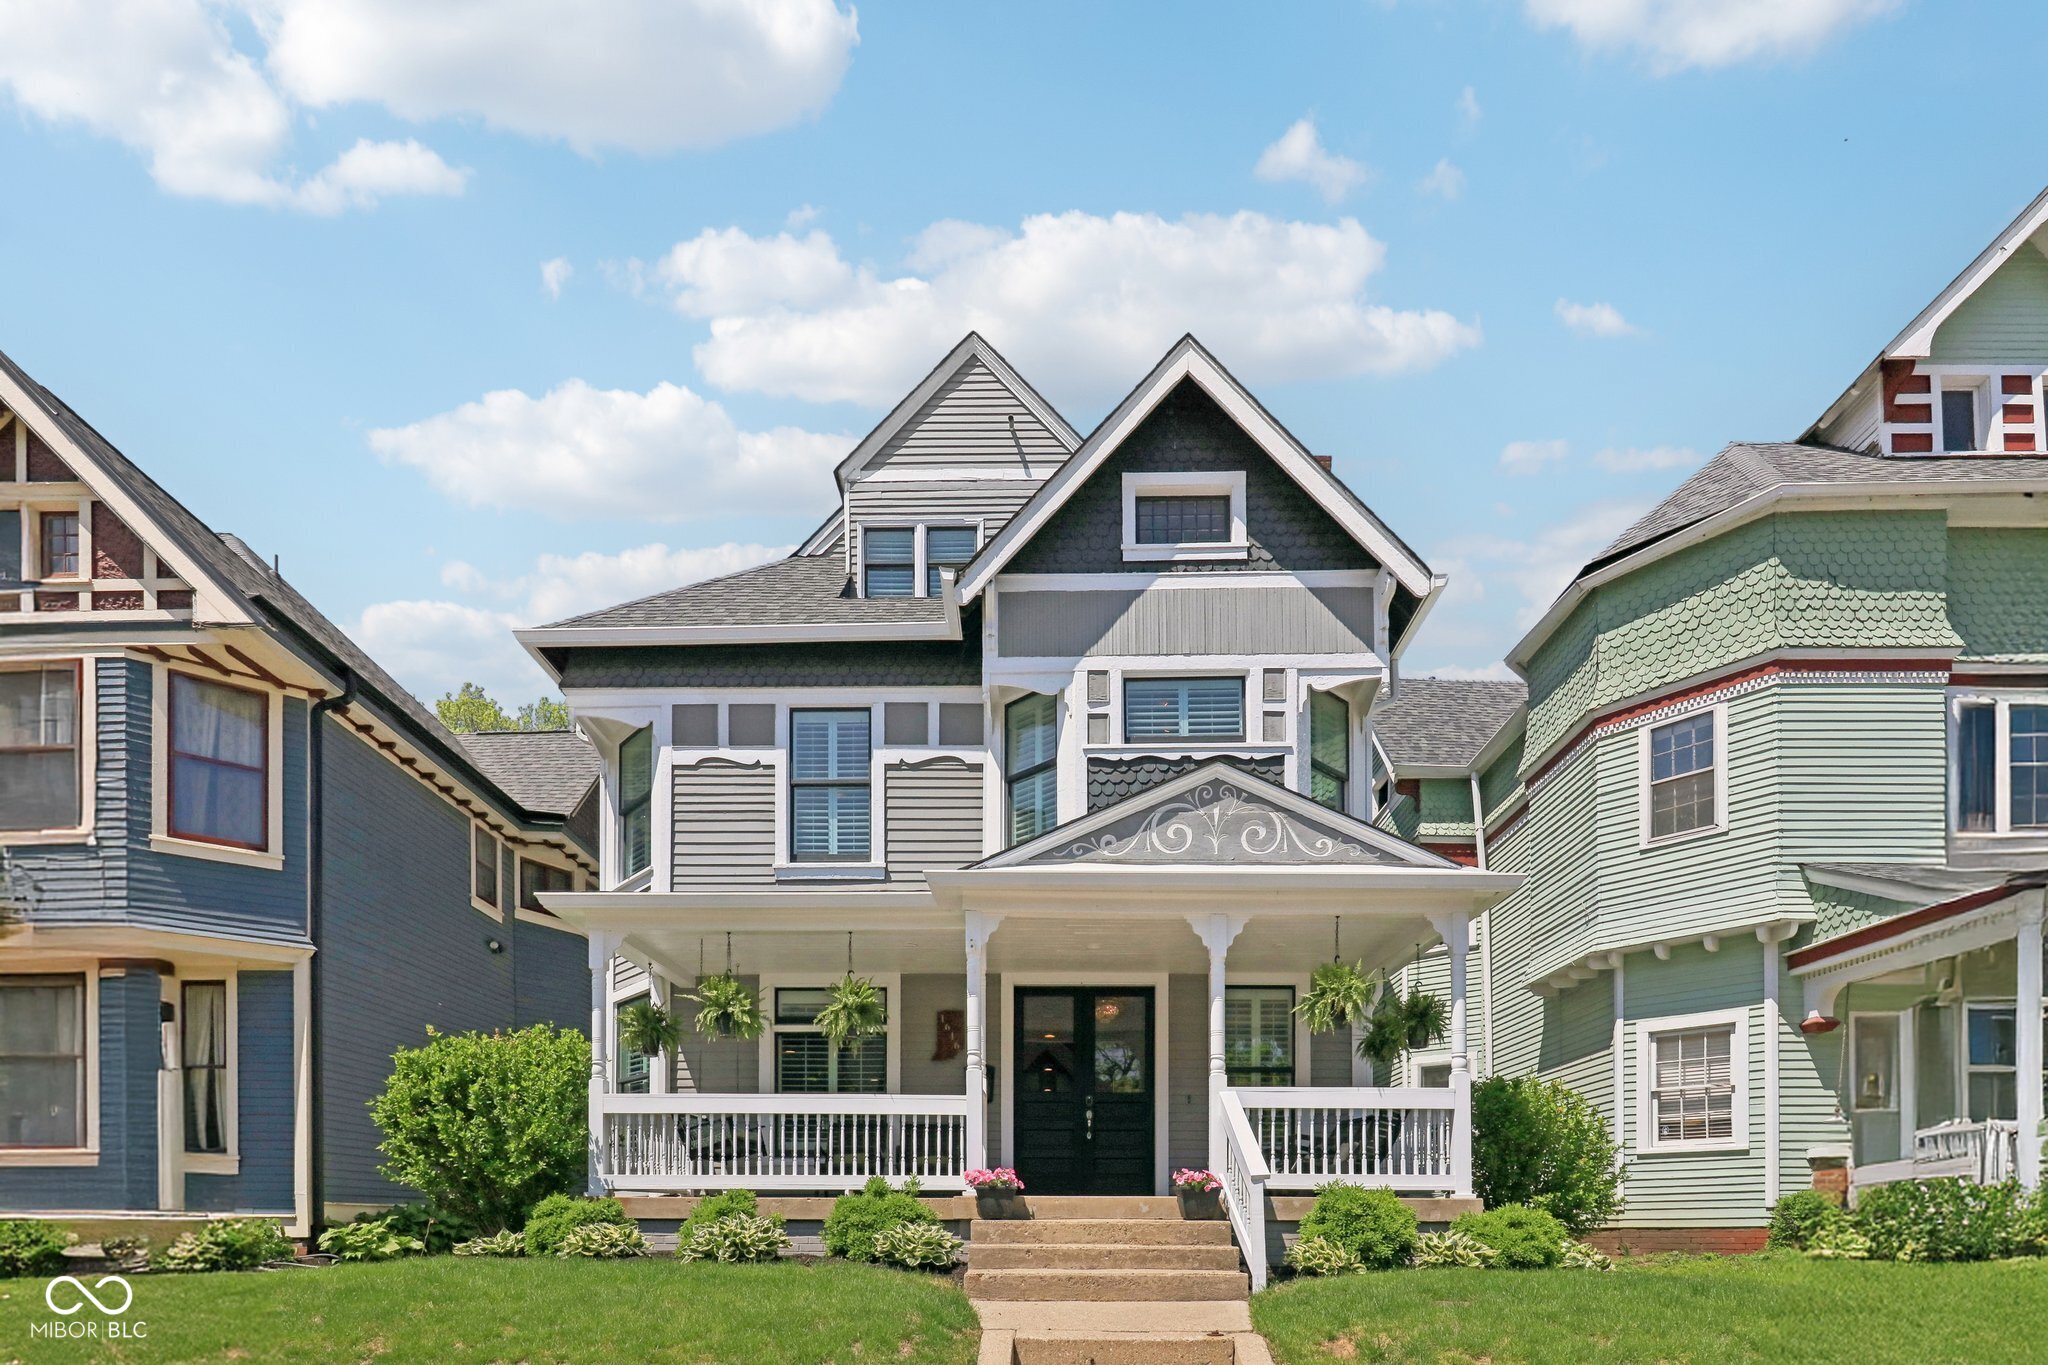
1890
847 N Park Ave, Indianapolis, IN 46202
$-2,195
Cash flow
-12.7%
Cash-on-Cash Return
3.2%
Cap rate
0.4%
Rent to Value Ratio
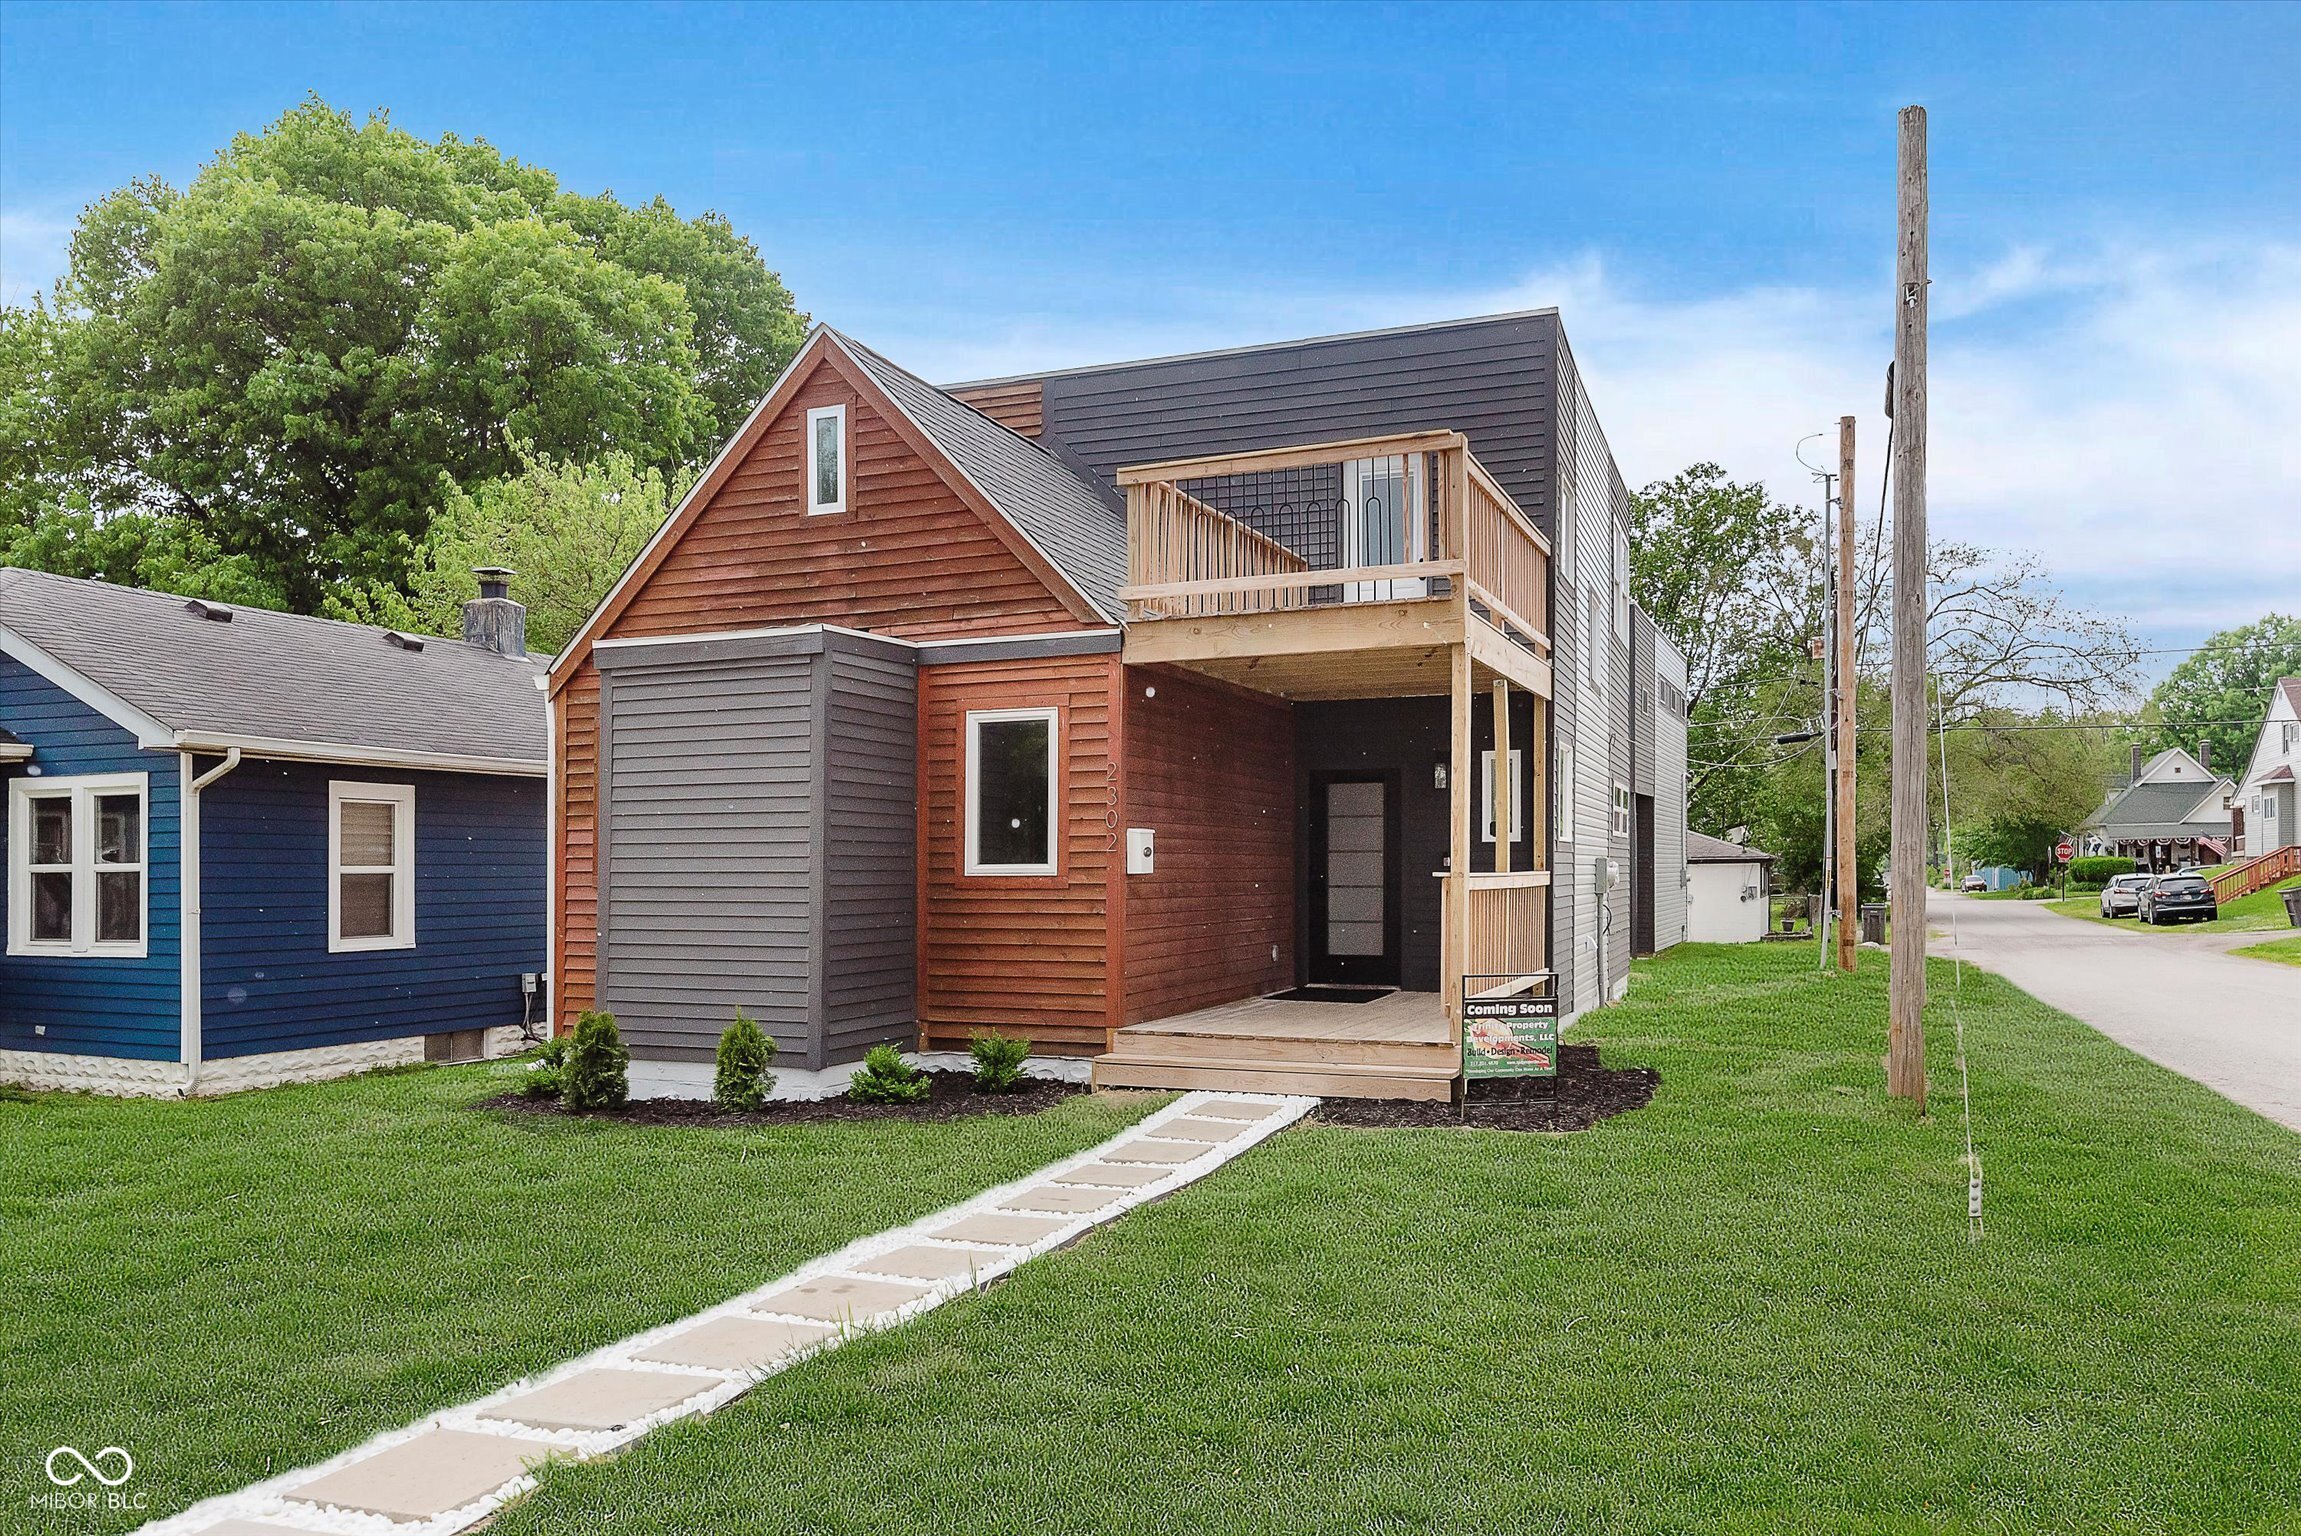
$450,000
3
bds
|
3
ba
|
1,652
sqft
|
built
1925
2302 S Pennsylvania St, Indianapolis, IN 46225
$-1,132
Cash flow
-13.1%
Cash-on-Cash Return
3.1%
Cap rate
0.4%
Rent to Value Ratio
$850,000
4
bds
|
4
ba
|
3,902
sqft
|
built
1948
8100 N Meridian St, Indianapolis, IN 46260
$-904
Cash flow
-5.5%
Cash-on-Cash Return
4.9%
Cap rate
0.6%
Rent to Value Ratio
$349,900
4
bds
|
3
ba
|
2,034
sqft
|
built
1967
2009 Friendship Dr, Indianapolis, IN 46217
$-550
Cash flow
-8.2%
Cash-on-Cash Return
4.3%
Cap rate
0.5%
Rent to Value Ratio
$350,000
3
bds
|
3
ba
|
1,947
sqft
|
built
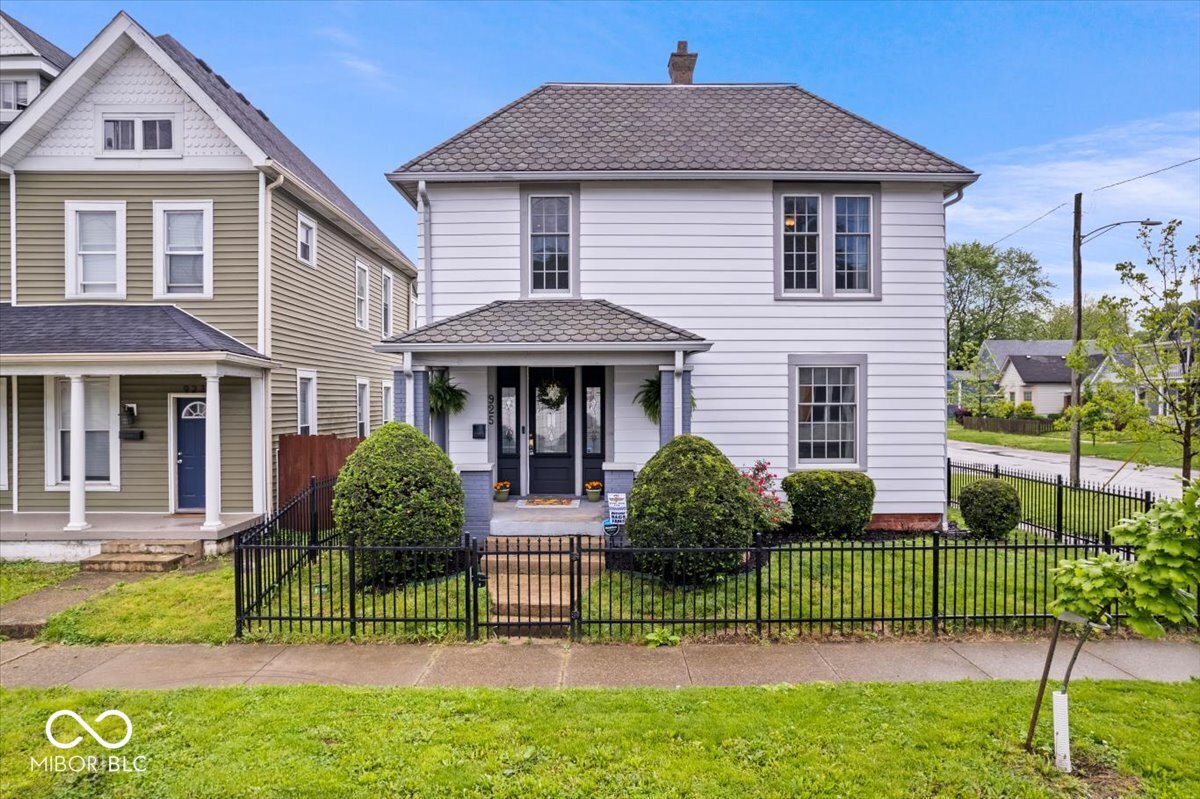
1900
925 S State Ave, Indianapolis, IN 46203
$-206
Cash flow
-3.1%
Cash-on-Cash Return
5.4%
Cap rate
0.7%
Rent to Value Ratio
$339,900
4
bds
|
3
ba
|
2,195
sqft
|
built
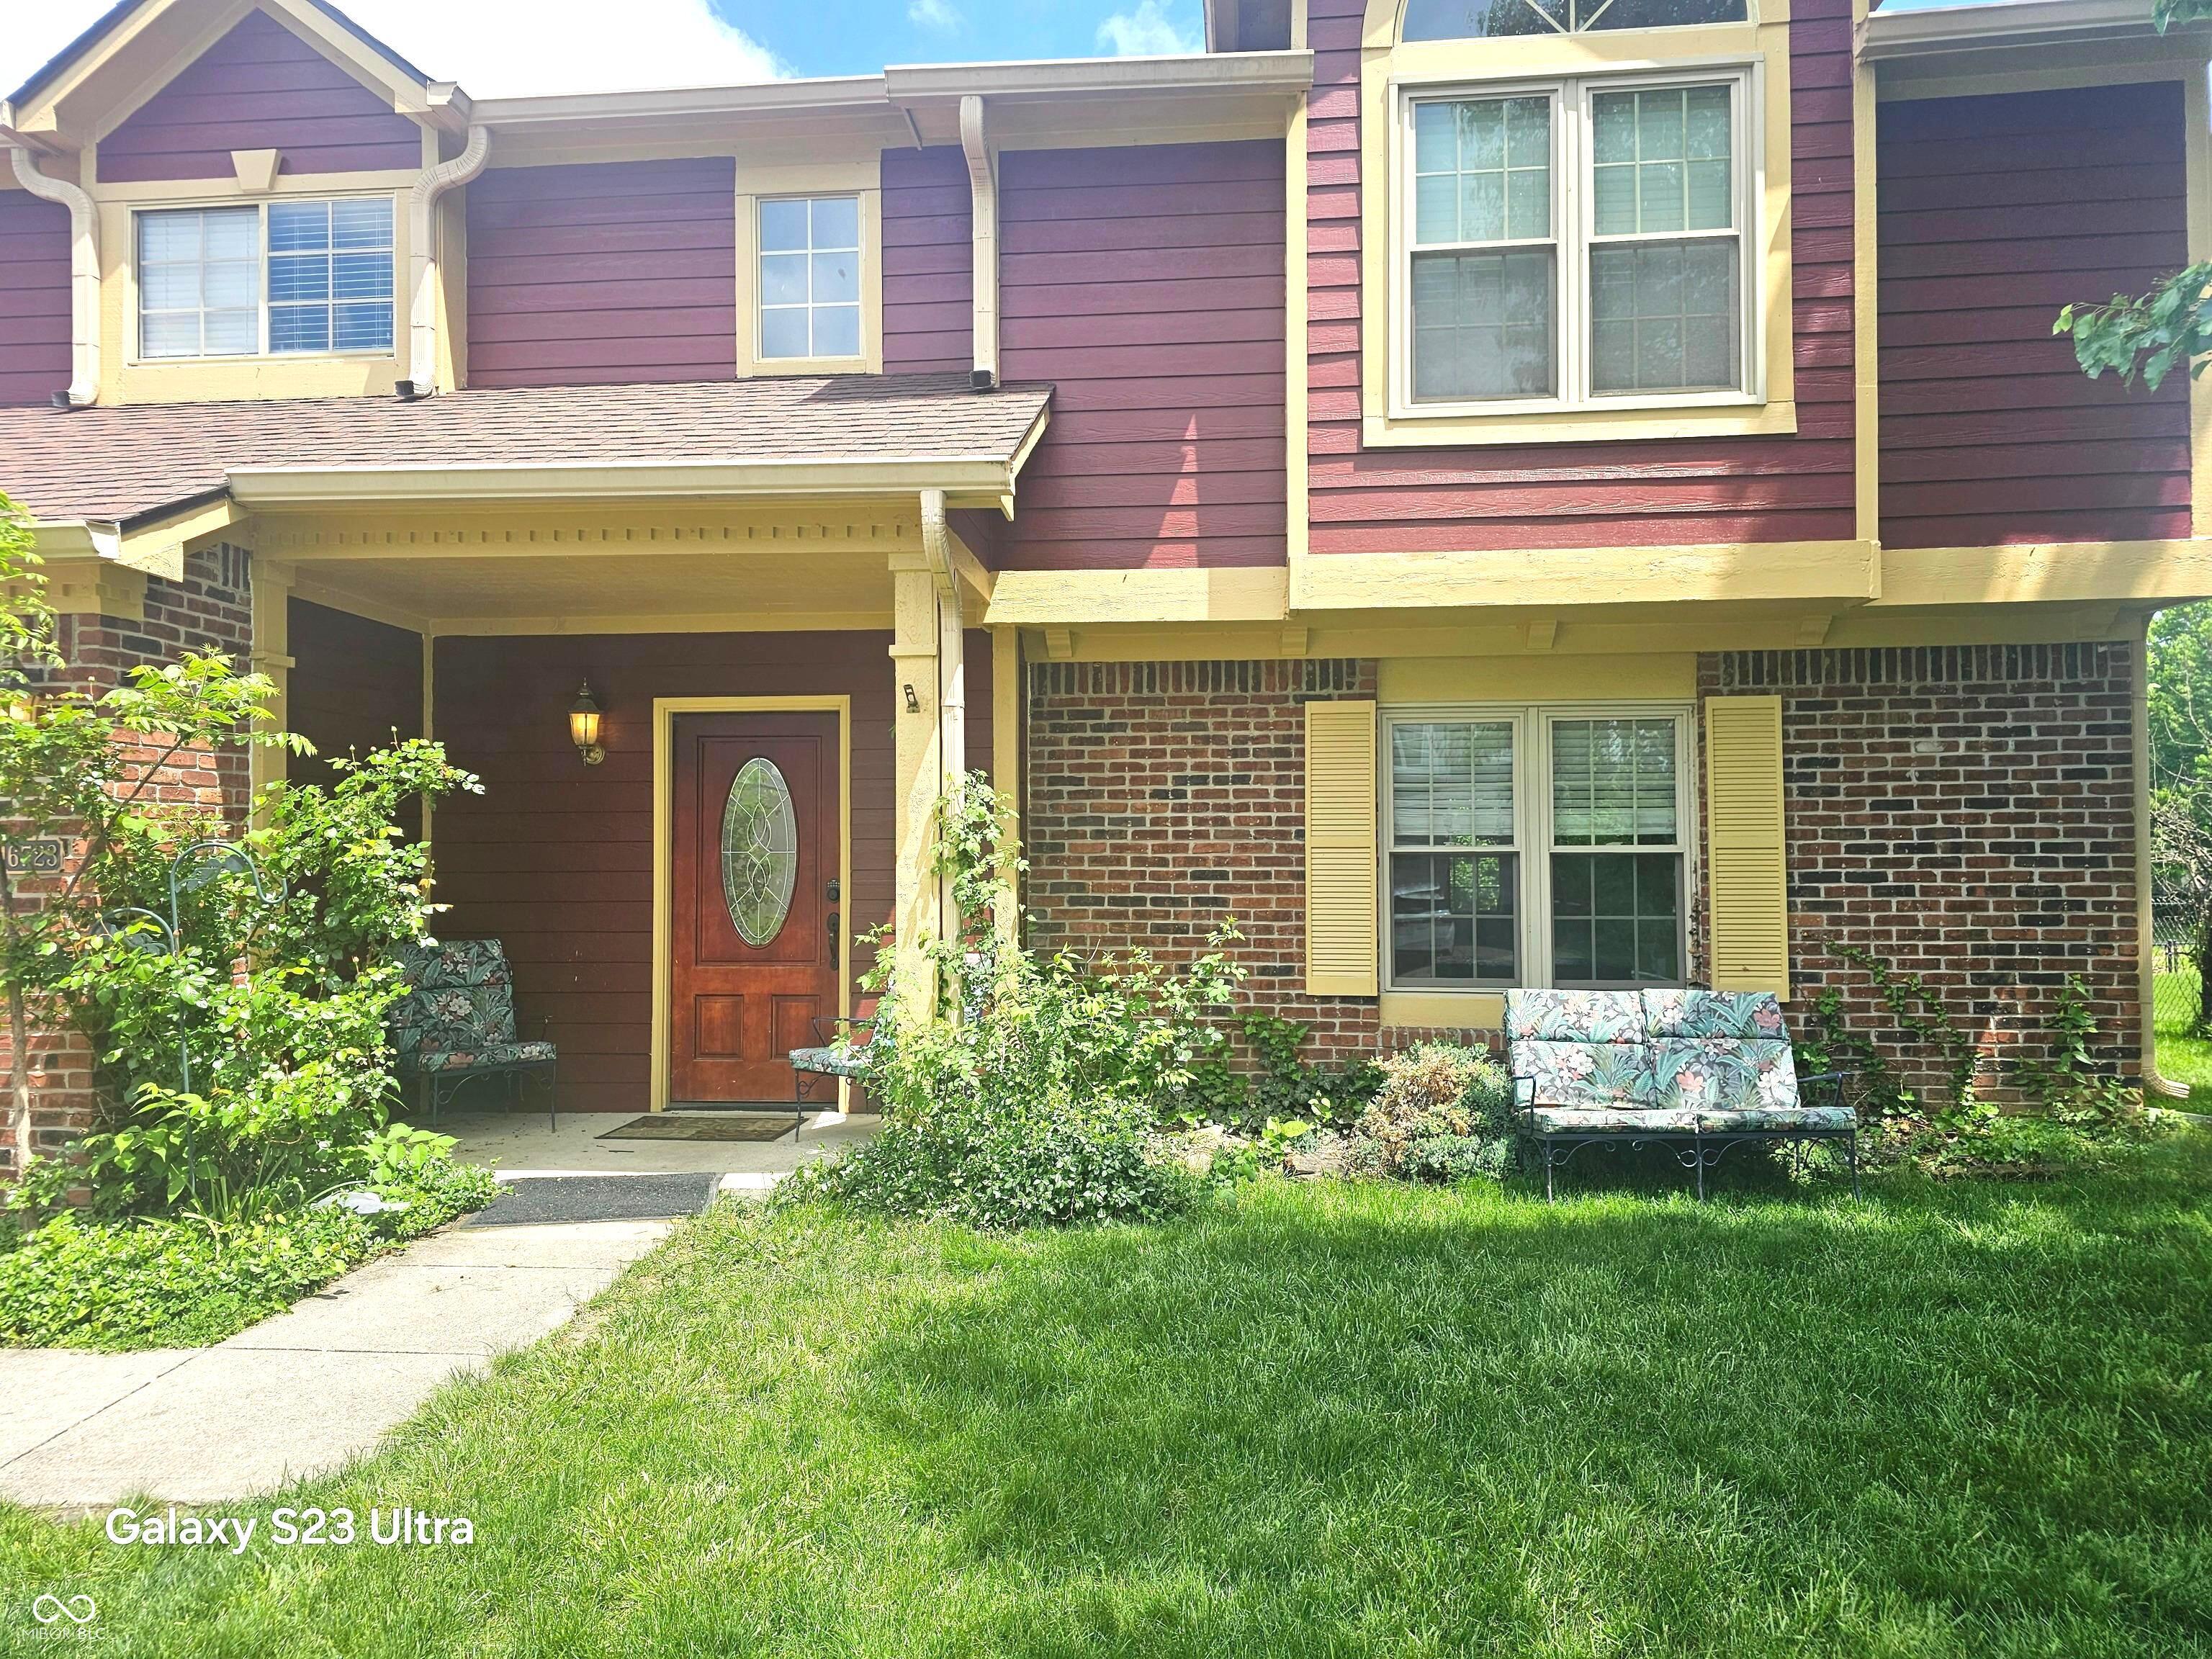
1991
6723 Silver Tree Dr, Indianapolis, IN 46236
$-252
Cash flow
-3.9%
Cash-on-Cash Return
5.3%
Cap rate
0.6%
Rent to Value Ratio
$250,000
3
bds
|
2
ba
|
1,340
sqft
|
built
1955
1718 Thaddeus St, Indianapolis, IN 46203
$-453
Cash flow
-9.5%
Cash-on-Cash Return
4.0%
Cap rate
0.5%
Rent to Value Ratio

$319,000
1
bds
|
1
ba
|
938
sqft
|
built
2015
622 E 10th St, Indianapolis, IN 46202
$-490
Cash flow
-8.0%
Cash-on-Cash Return
4.3%
Cap rate
0.7%
Rent to Value Ratio
$940,000
5
bds
|
4
ba
|
4,923
sqft
|
built
1894
1616 N Delaware St, Indianapolis, IN 46202
$-2,607
Cash flow
-14.5%
Cash-on-Cash Return
2.8%
Cap rate
0.3%
Rent to Value Ratio

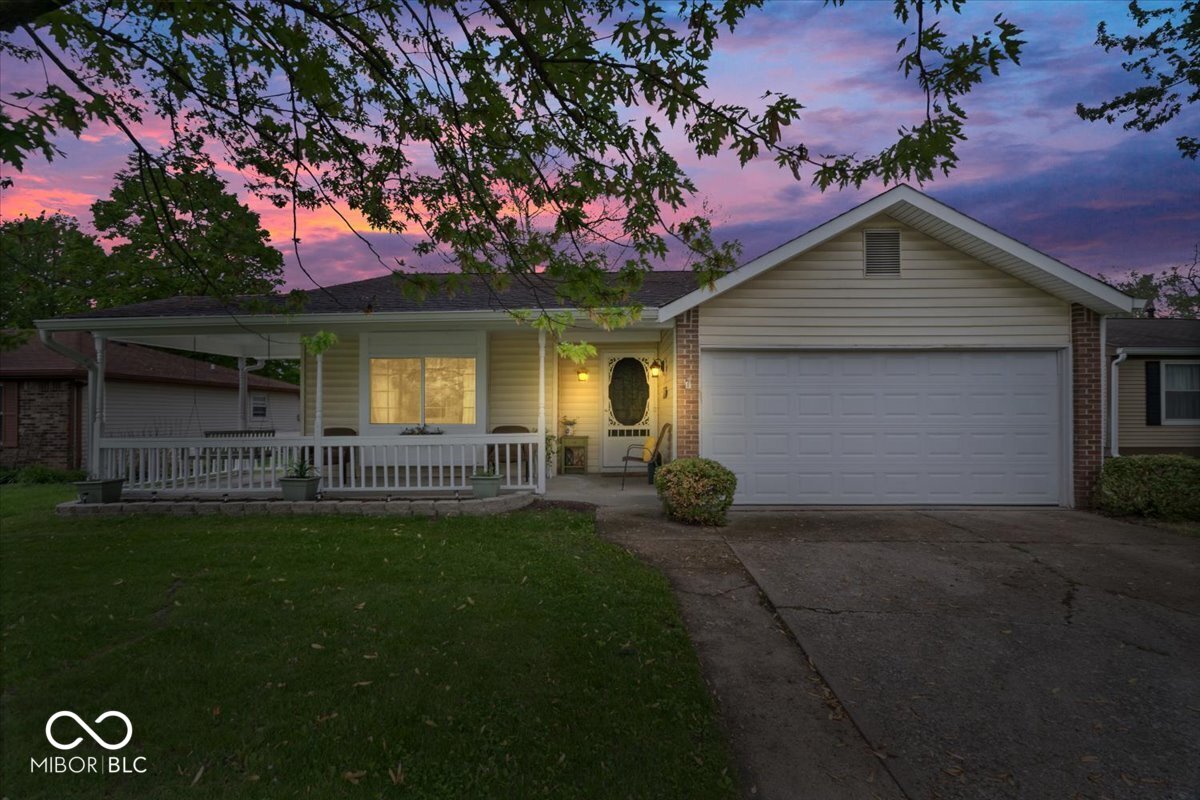
$169,900
3
bds
|
2
ba
|
1,404
sqft
|
built
1930
4943 S State Ave, Indianapolis, IN 46227
$96
Cash flow
2.9%
Cash-on-Cash Return
6.8%
Cap rate
0.8%
Rent to Value Ratio
$529,000
4
bds
|
3
ba
|
2,487
sqft
|
built
1992
7113 Lakeside Woods Dr, Indianapolis, IN 46278
$-1,014
Cash flow
-10.0%
Cash-on-Cash Return
3.8%
Cap rate
0.5%
Rent to Value Ratio
$200,000
2
bds
|
2
ba
|
1,419
sqft
|
built
1955
114 E 27th St, Indianapolis, IN 46205
$58
Cash flow
1.5%
Cash-on-Cash Return
6.5%
Cap rate
0.9%
Rent to Value Ratio
$142,000
2
bds
|
1
ba
|
960
sqft
|
built
1930
1401 W 34th St, Indianapolis, IN 46208
$239
Cash flow
8.8%
Cash-on-Cash Return
8.2%
Cap rate
1.0%
Rent to Value Ratio
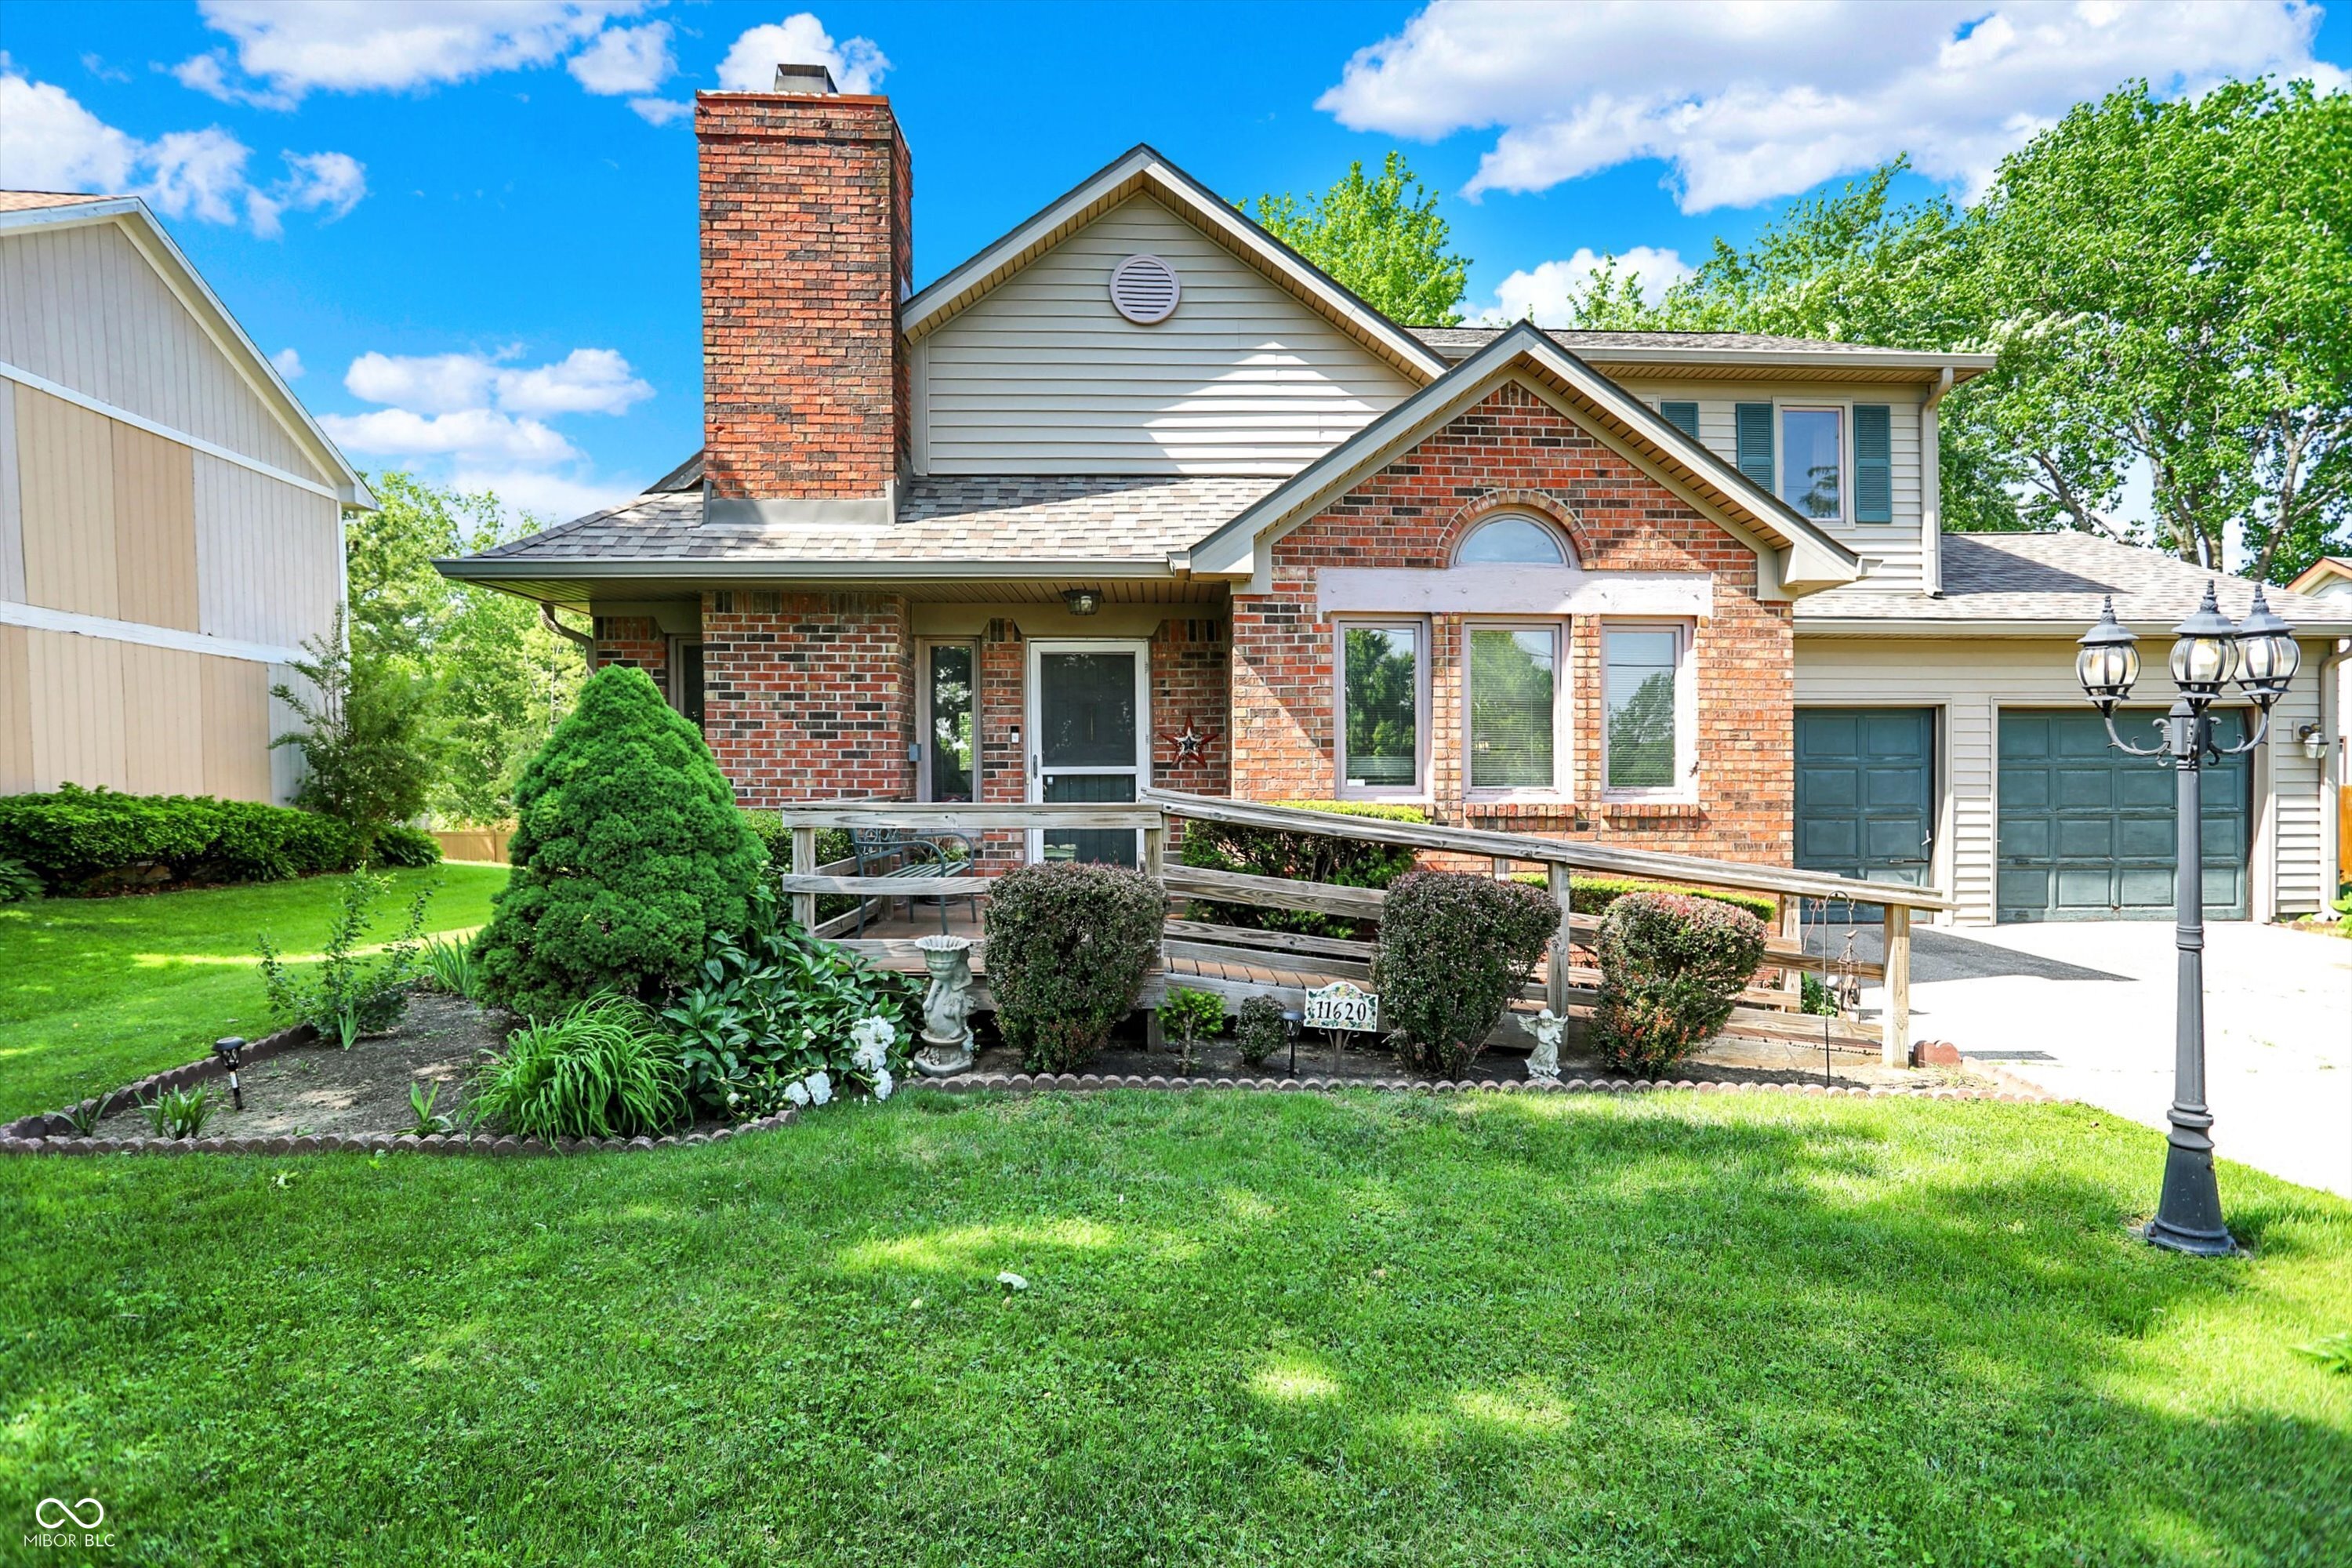
$299,000
3
bds
|
2
ba
|
1,749
sqft
|
built
1986
11620 E 75th St, Indianapolis, IN 46236
$-152
Cash flow
-2.7%
Cash-on-Cash Return
5.5%
Cap rate
0.7%
Rent to Value Ratio
$429,900
3
bds
|
1
ba
|
1,902
sqft
|
built
1933
744 Gilbert Ave, Indianapolis, IN 46227
$-960
Cash flow
-11.7%
Cash-on-Cash Return
3.5%
Cap rate
0.4%
Rent to Value Ratio
$295,000
3
bds
|
3
ba
|
1,976
sqft
|
built
1964
8417 S Sherman Dr, Indianapolis, IN 46237
$-476
Cash flow
-8.4%
Cash-on-Cash Return
4.2%
Cap rate
0.5%
Rent to Value Ratio
$687,000
5
bds
|
4
ba
|
5,118
sqft
|
built
1994
4601 Fairhope Dr, Indianapolis, IN 46237
$-1,048
Cash flow
-8.0%
Cash-on-Cash Return
4.3%
Cap rate
0.5%
Rent to Value Ratio
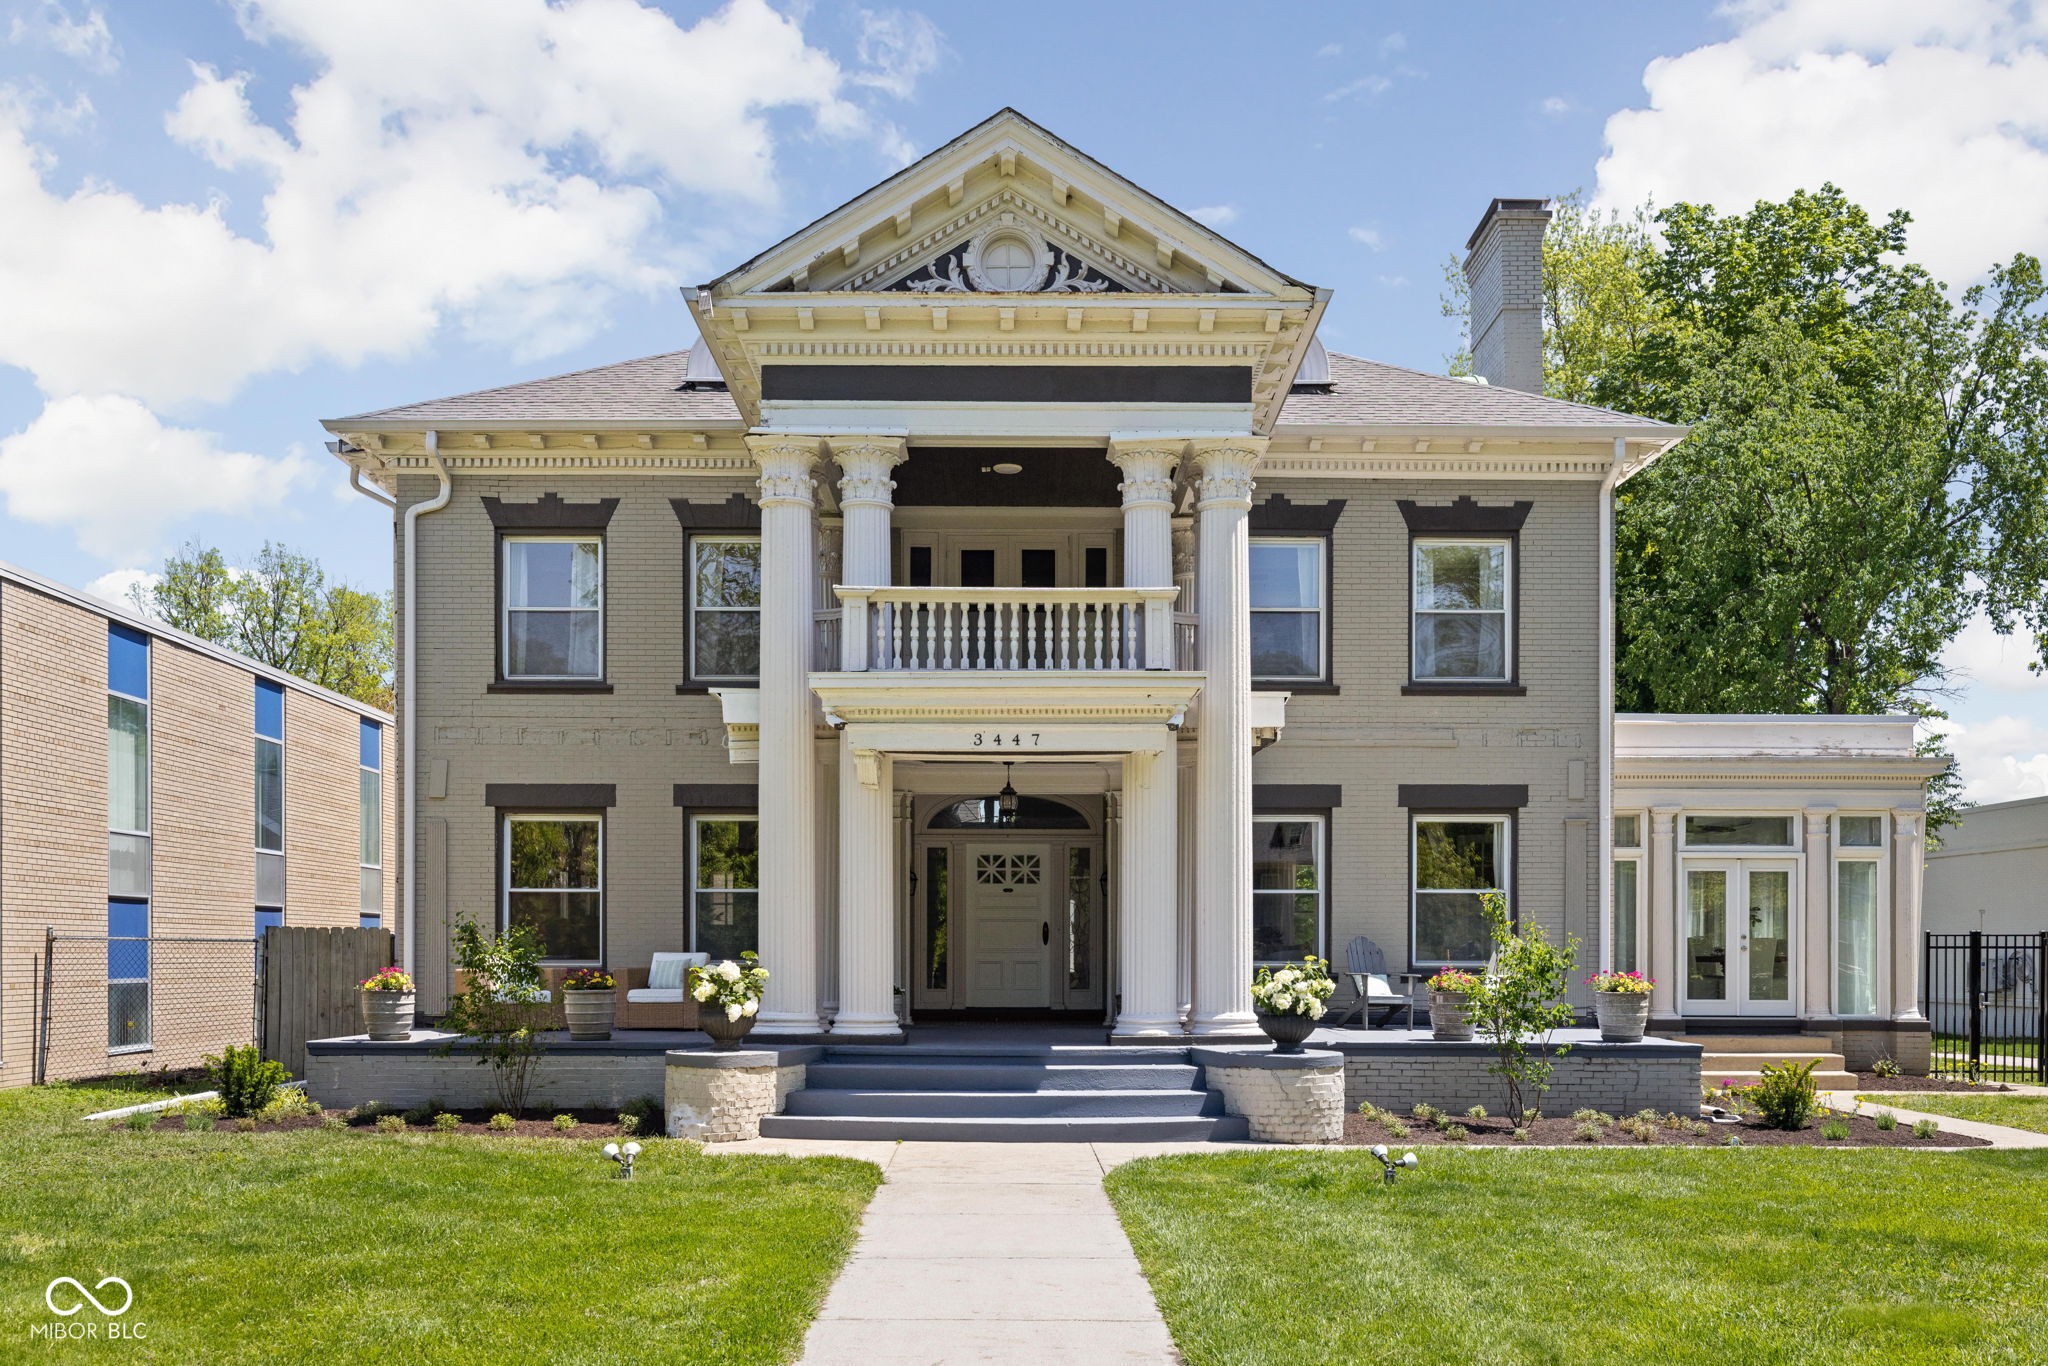
$850,000
8
bds
|
6
ba
|
6,773
sqft
|
built
1915
3447 Washington Blvd, Indianapolis, IN 46205
$-1,939
Cash flow
-11.9%
Cash-on-Cash Return
3.4%
Cap rate
0.4%
Rent to Value Ratio

$240,000
3
bds
|
2
ba
|
1,309
sqft
|
built
1951
1021 N Bolton Ave, Indianapolis, IN 46219
$13
Cash flow
0.3%
Cash-on-Cash Return
6.2%
Cap rate
0.8%
Rent to Value Ratio
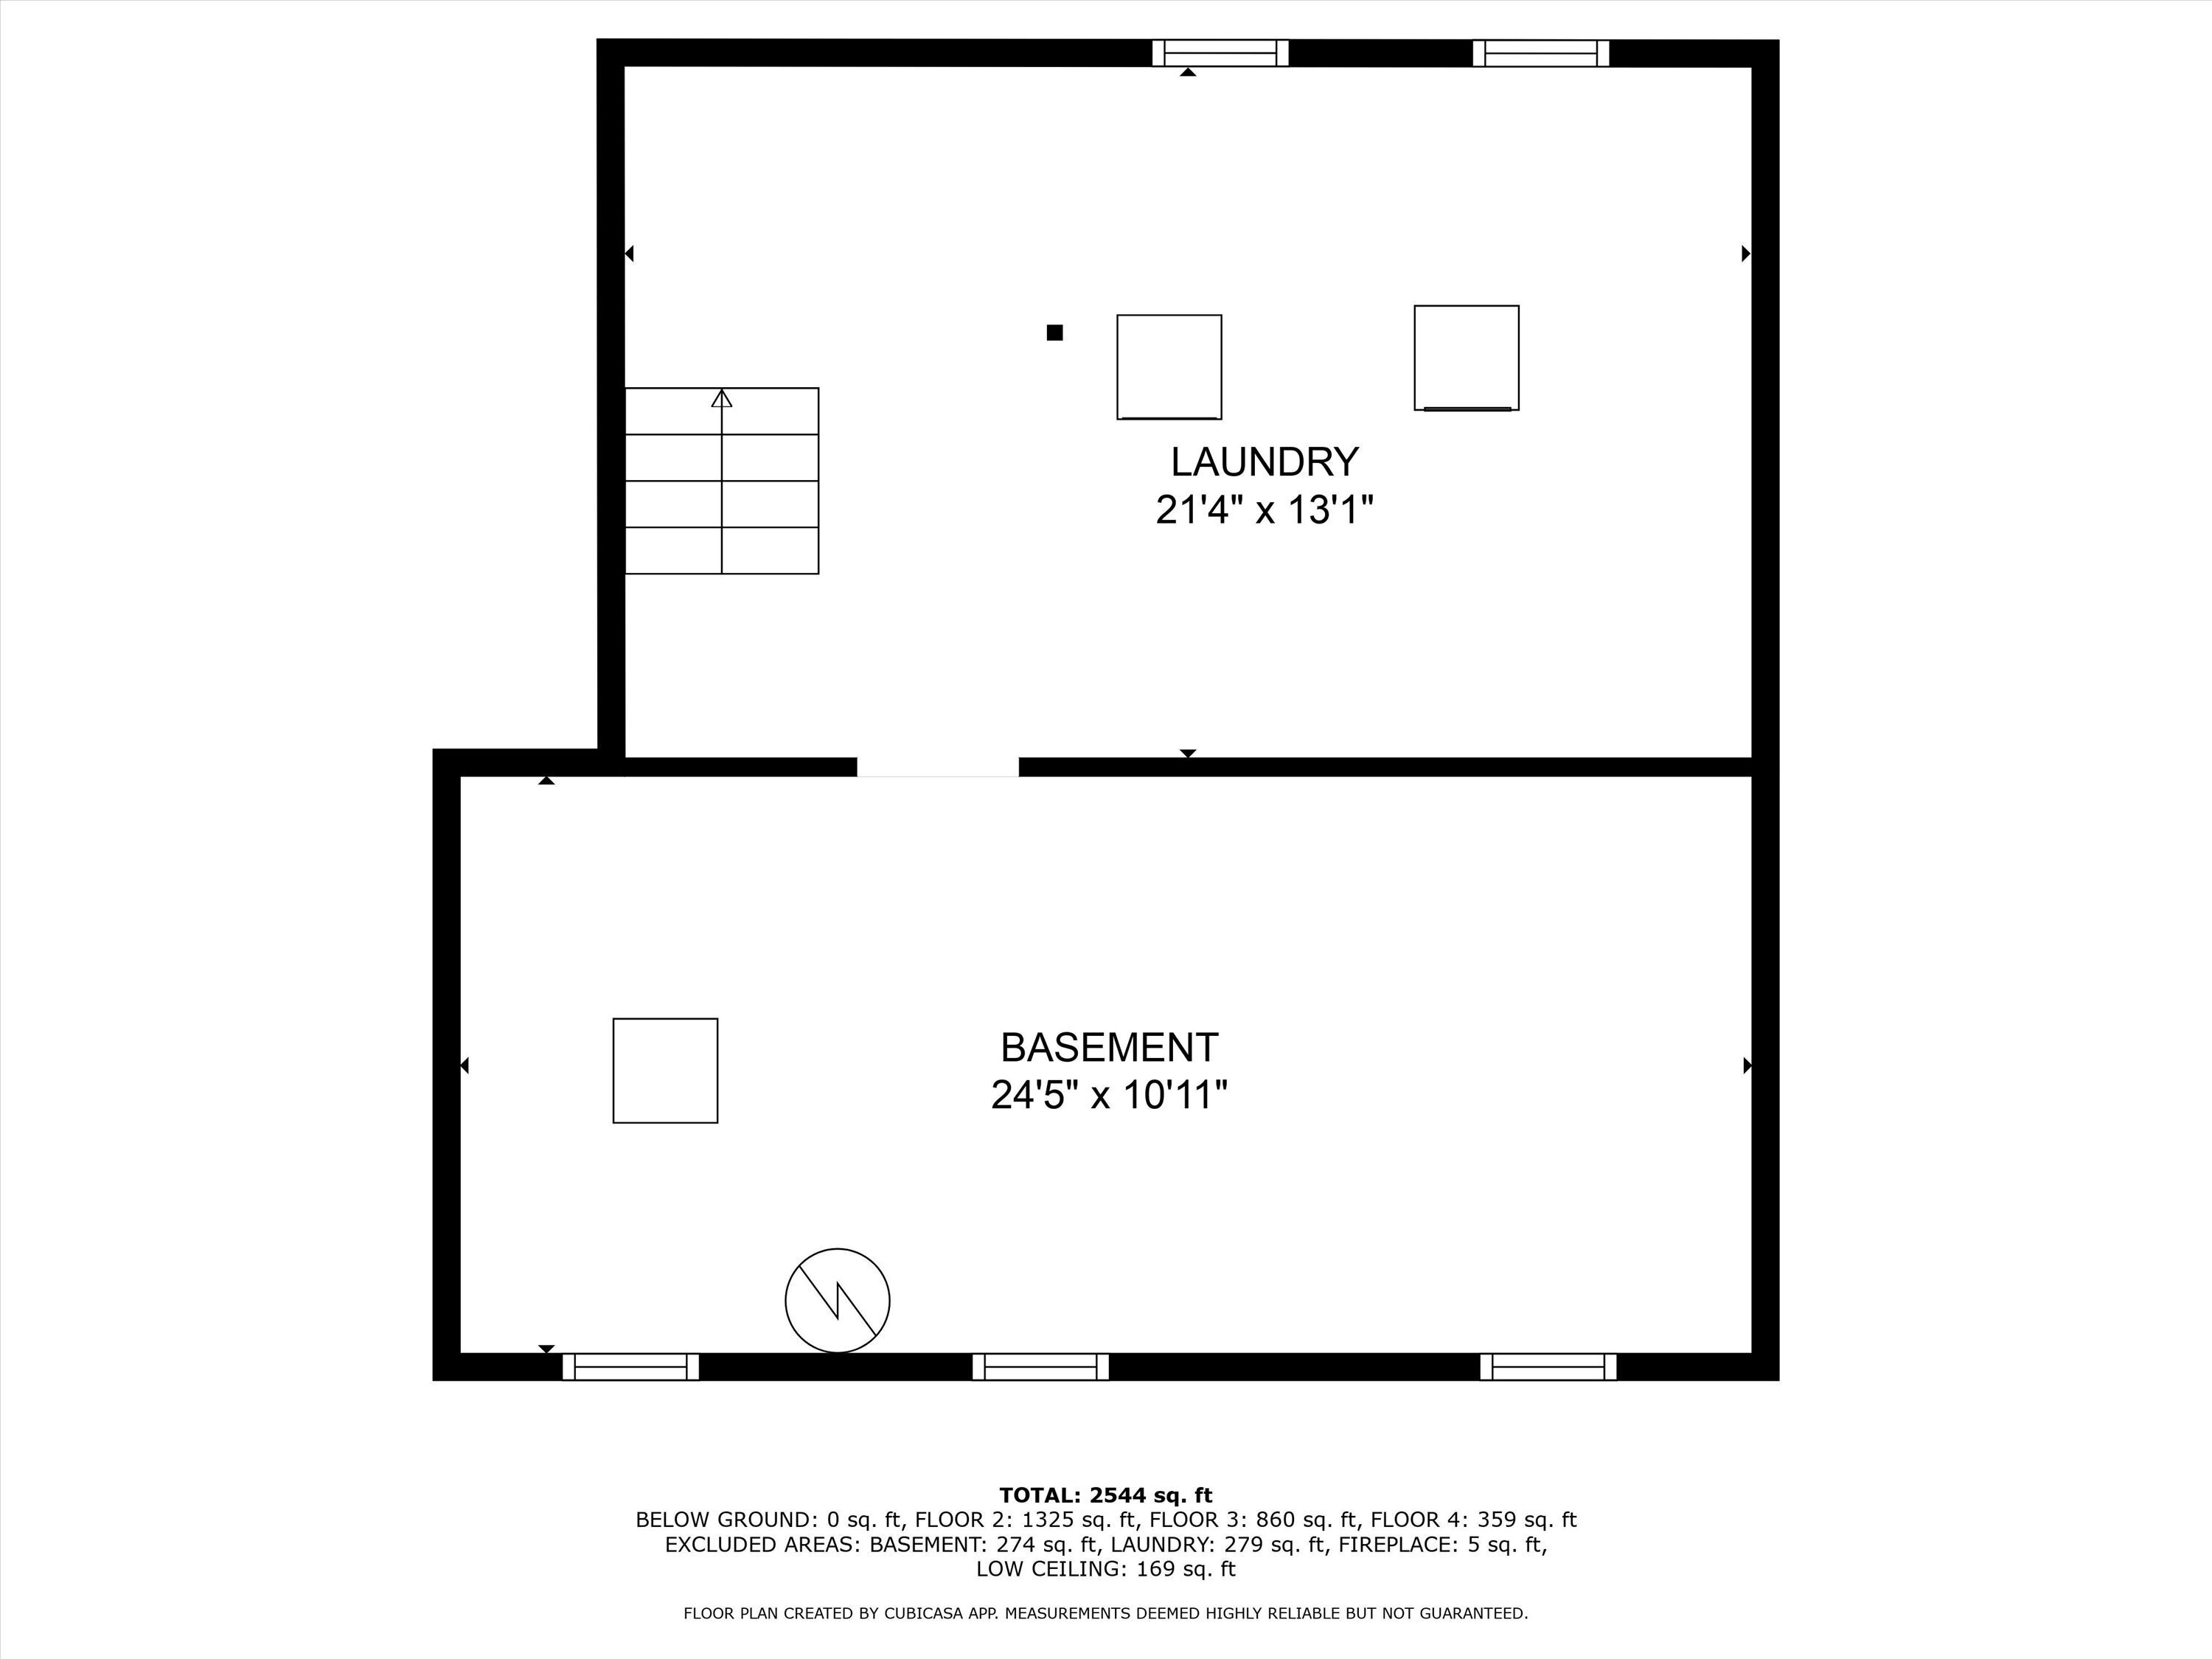
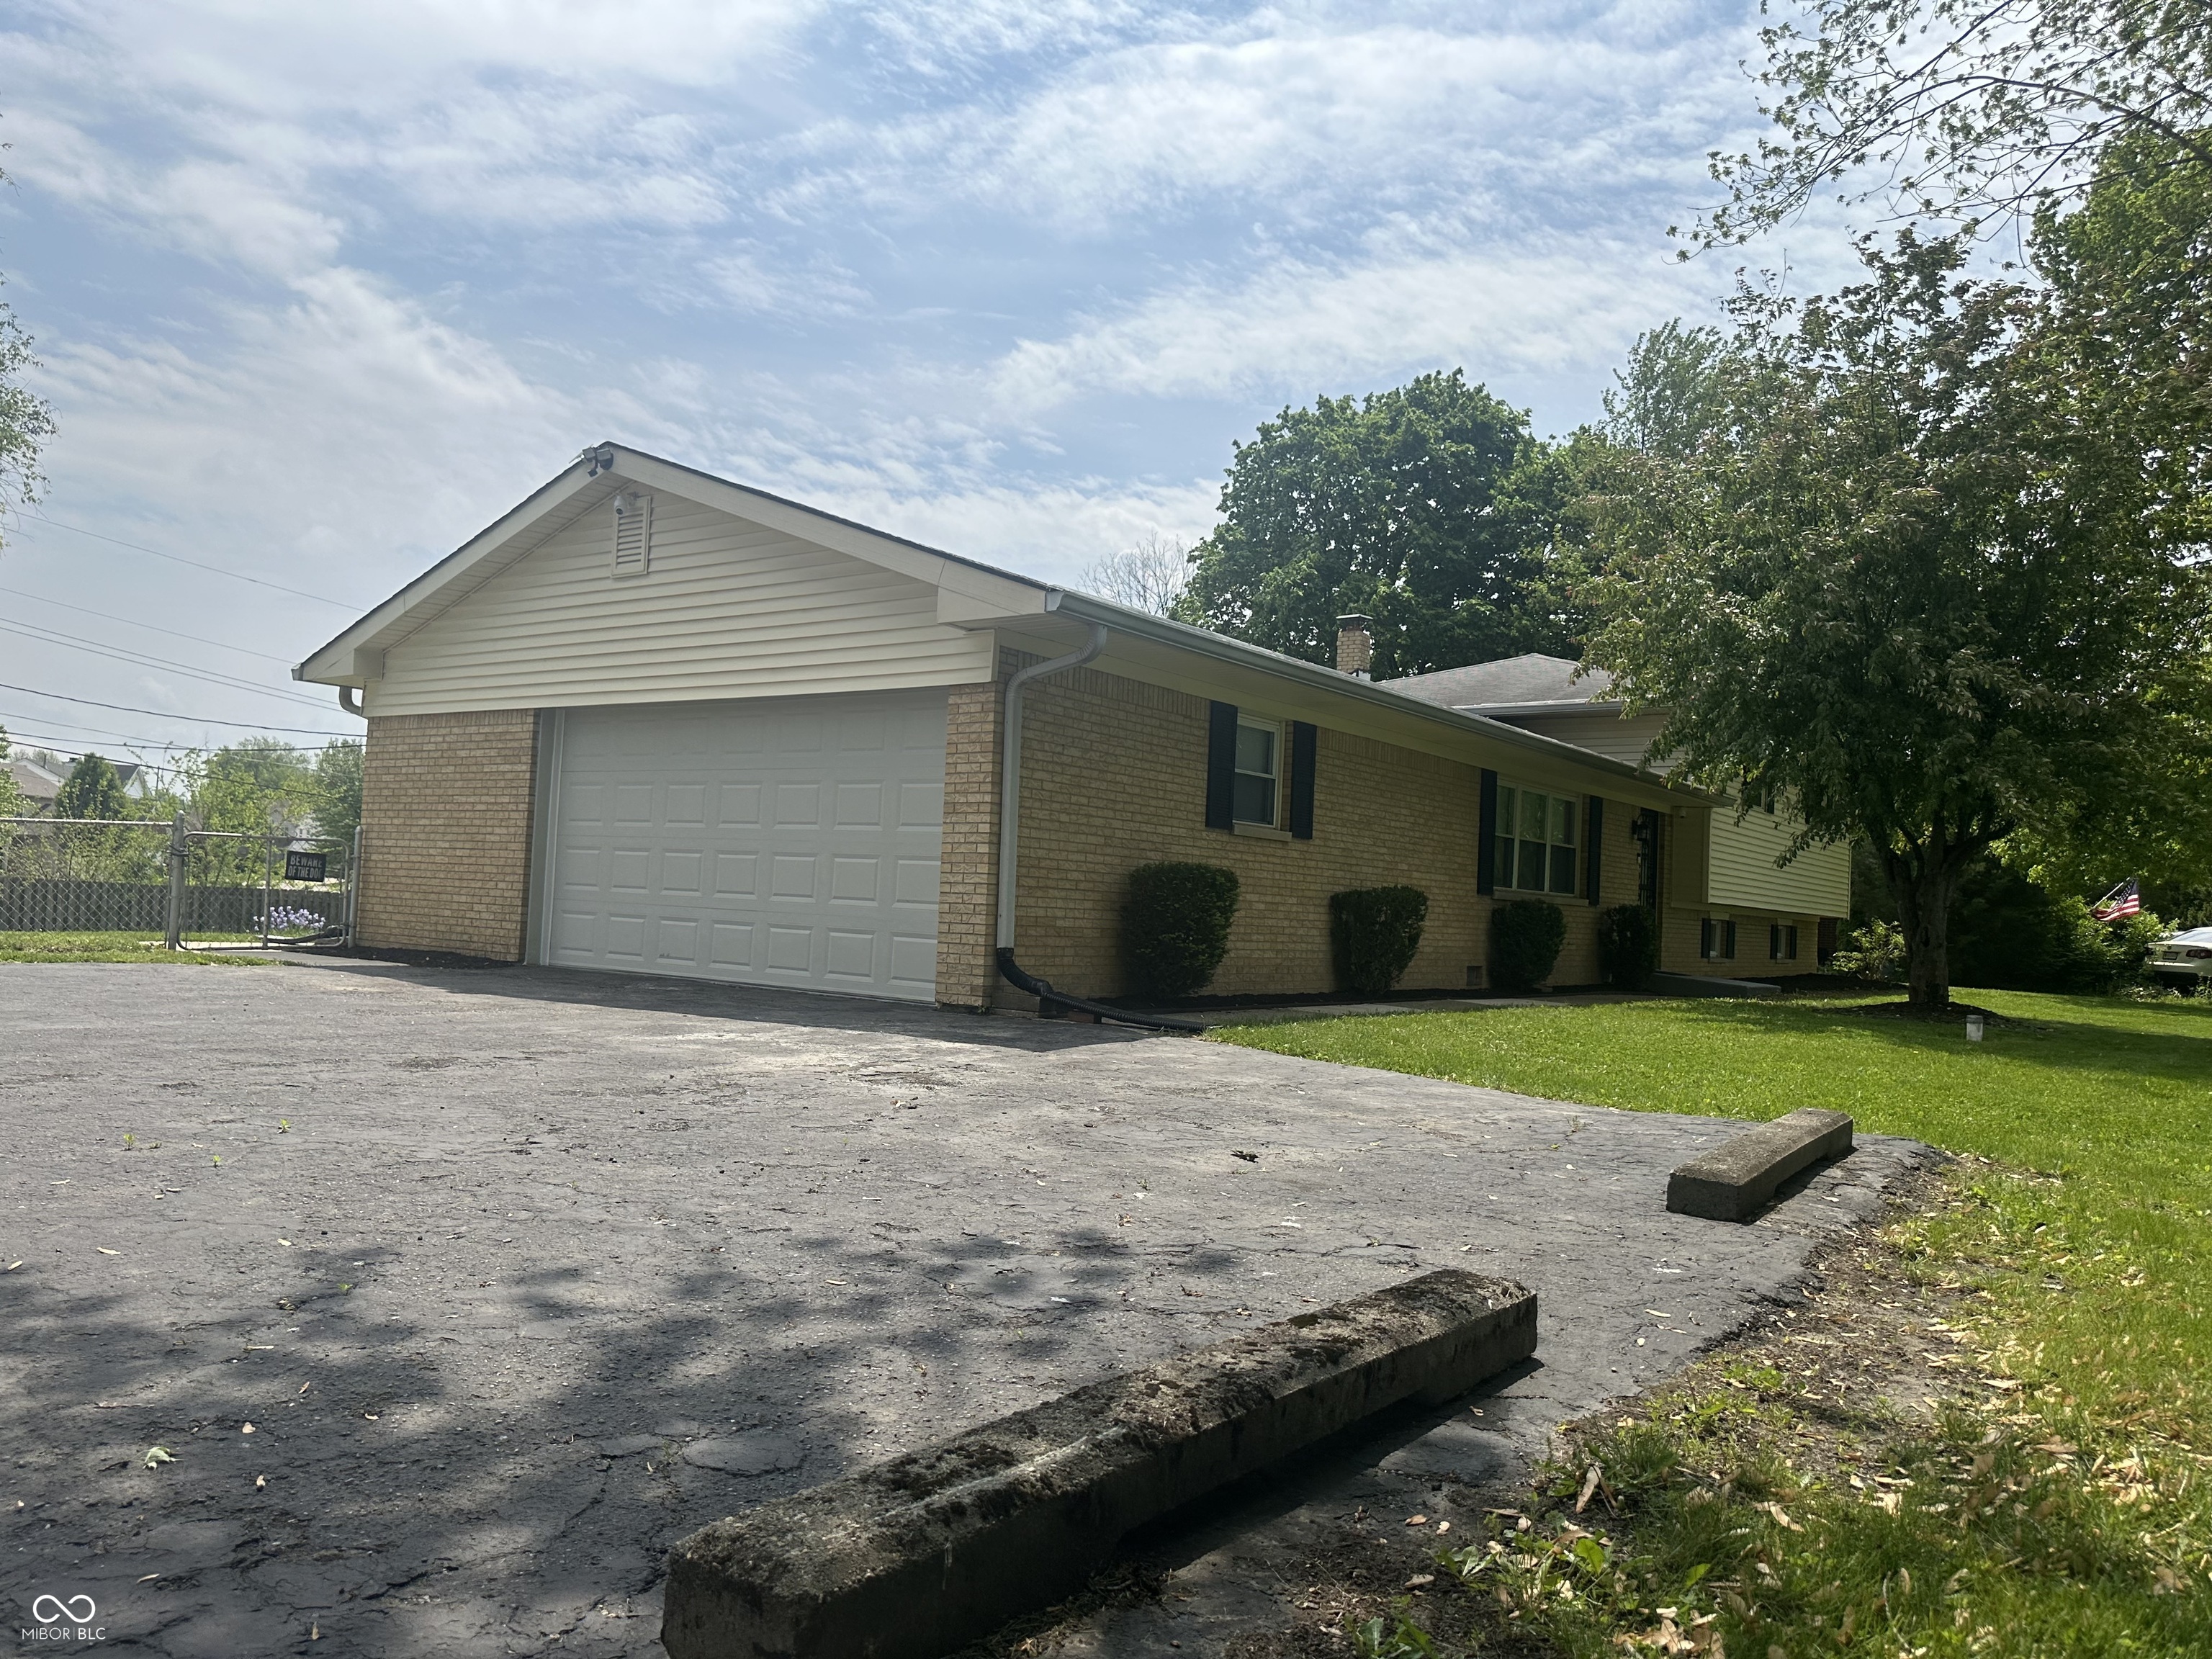
$589,900
5
bds
|
3
ba
|
2,544
sqft
|
built
1923
4447 N College Ave, Indianapolis, IN 46205
$-1,021
Cash flow
-9.0%
Cash-on-Cash Return
4.1%
Cap rate
0.5%
Rent to Value Ratio
$425,000
4
bds
|
3
ba
|
3,389
sqft
|
built
1959
426 Oakwood Dr, Indianapolis, IN 46260
$-176
Cash flow
-2.2%
Cash-on-Cash Return
5.6%
Cap rate
0.7%
Rent to Value Ratio
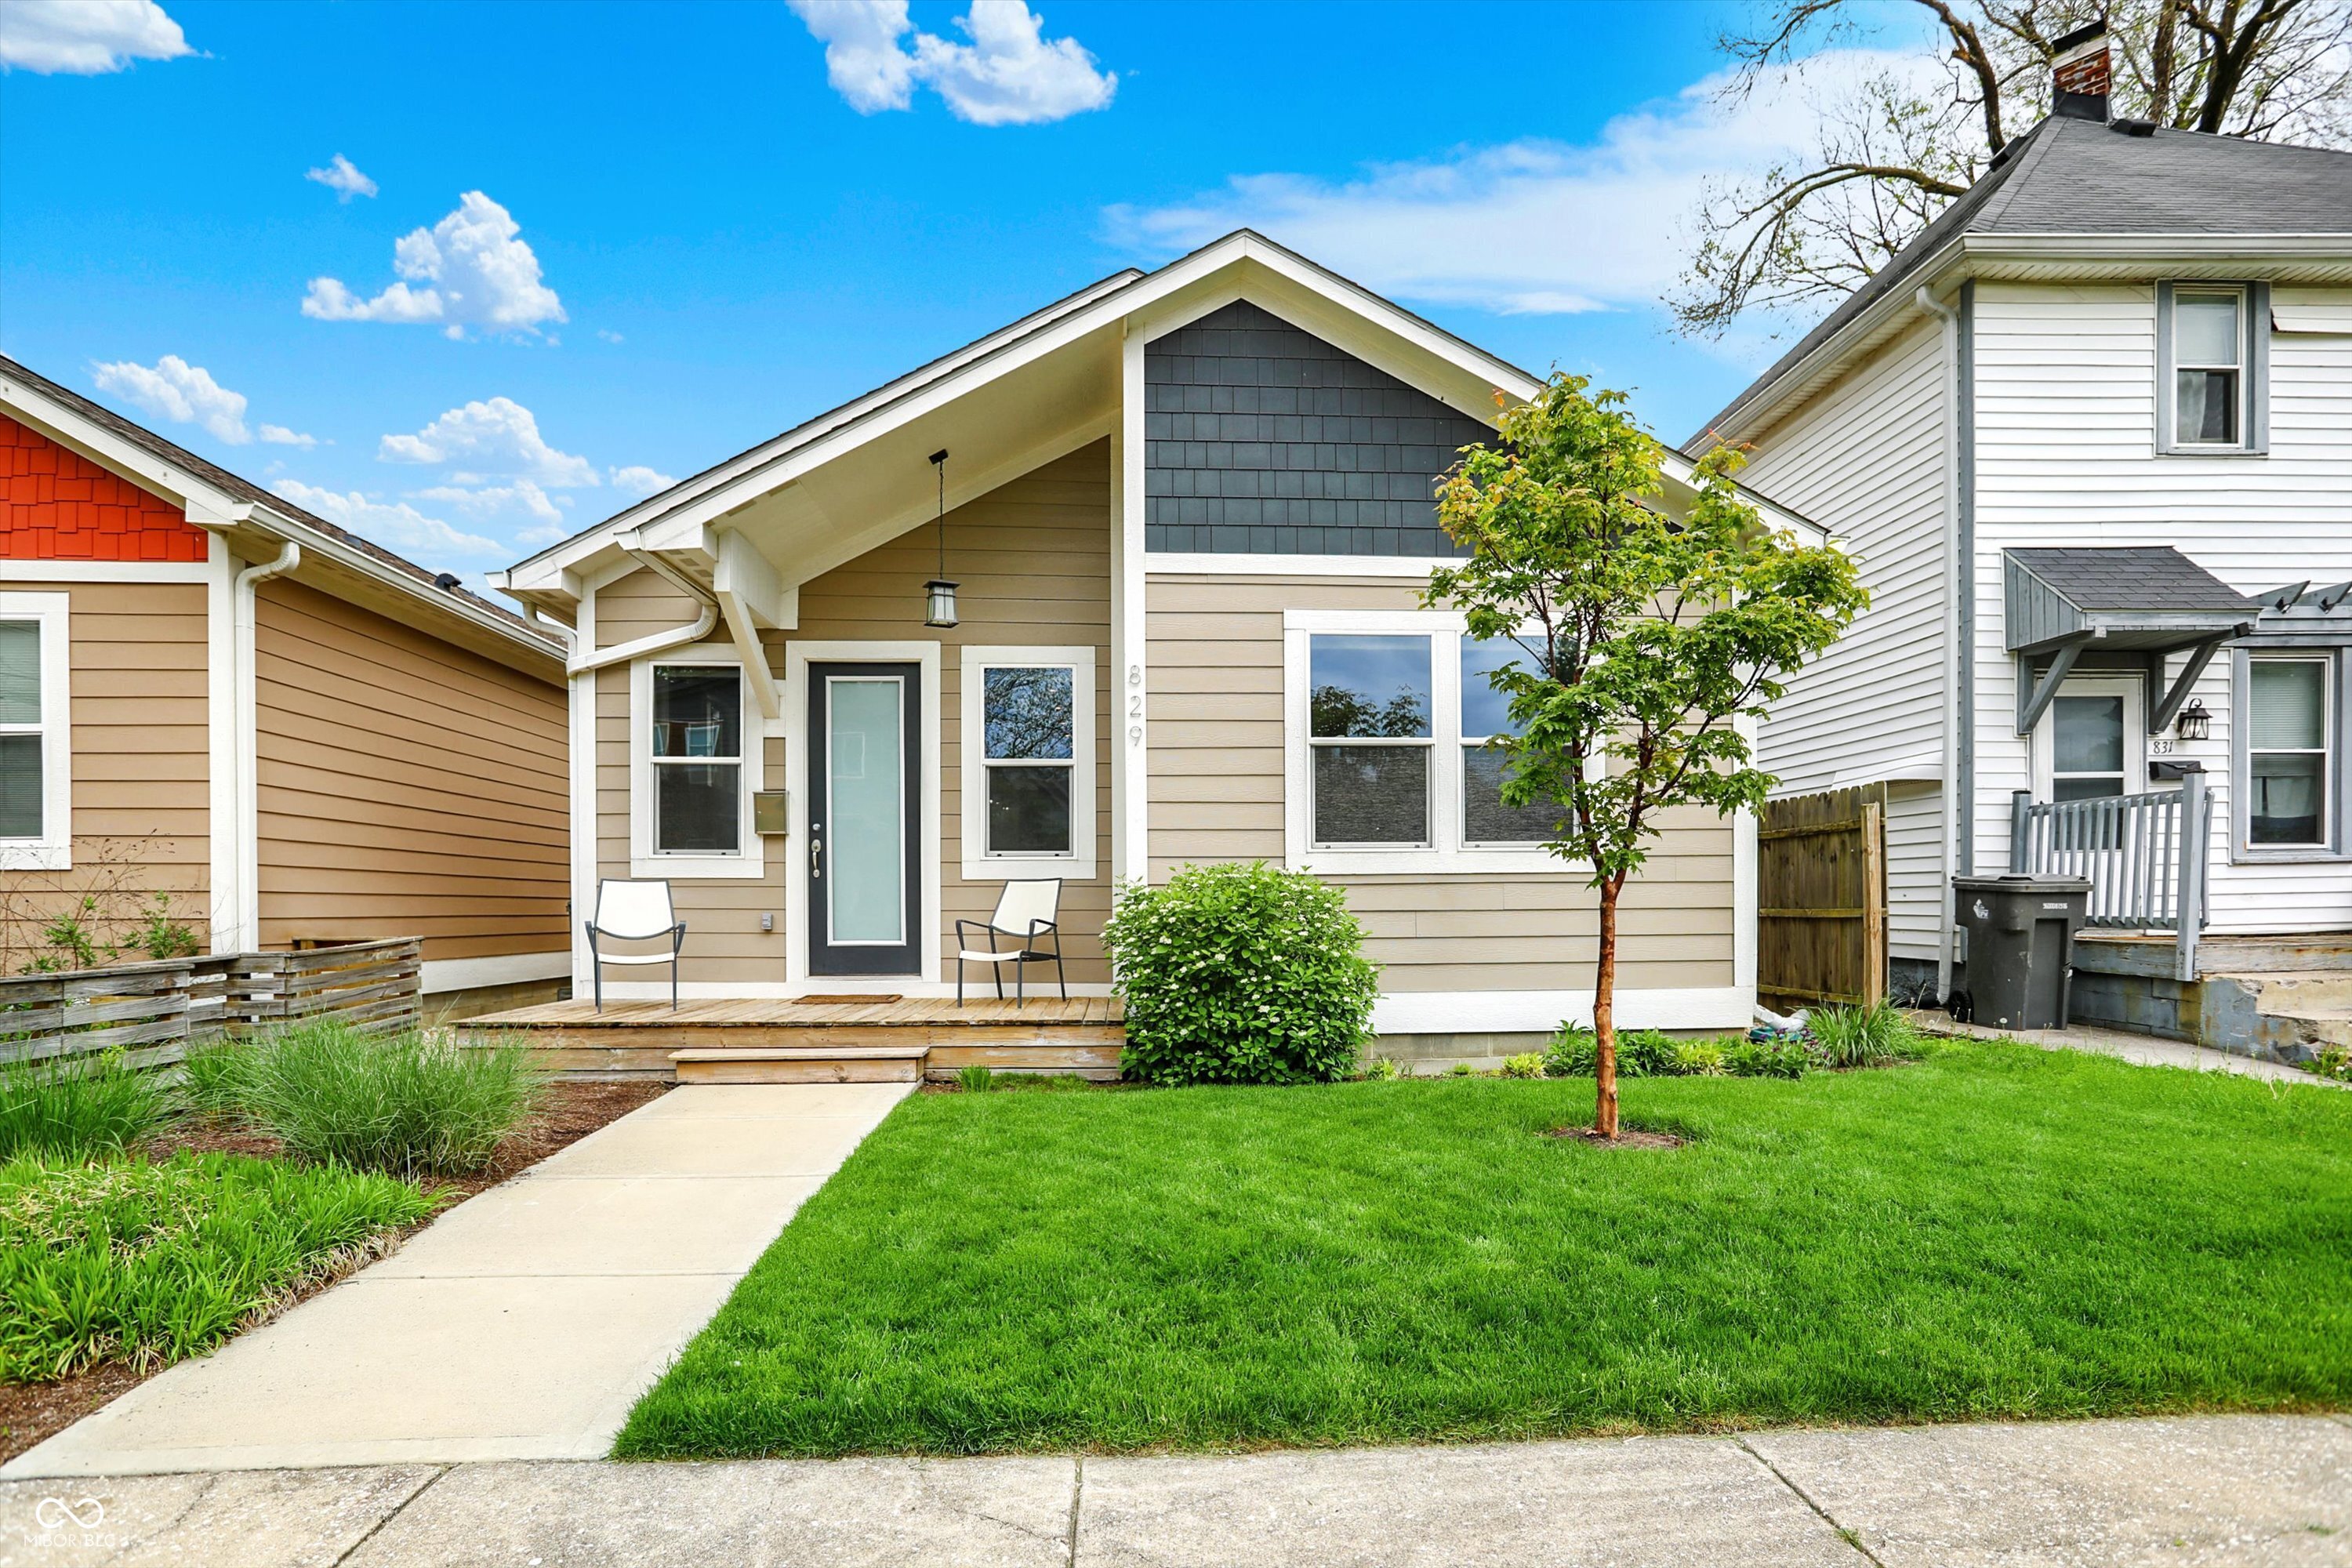
$335,000
2
bds
|
2
ba
|
1,176
sqft
|
built
2017
829 Olive St, Indianapolis, IN 46203
$-474
Cash flow
-7.4%
Cash-on-Cash Return
4.4%
Cap rate
0.5%
Rent to Value Ratio
$220,000
3
bds
|
2
ba
|
1,172
sqft
|
built
1986
1002 Prairie Depot, Indianapolis, IN 46241
$-23
Cash flow
-0.5%
Cash-on-Cash Return
6.0%
Cap rate
0.7%
Rent to Value Ratio

$332,500
3
bds
|
2
ba
|
1,728
sqft
|
built
1921
5603 S Randolph St, Indianapolis, IN 46227
$-599
Cash flow
-9.4%
Cash-on-Cash Return
4.0%
Cap rate
0.5%
Rent to Value Ratio
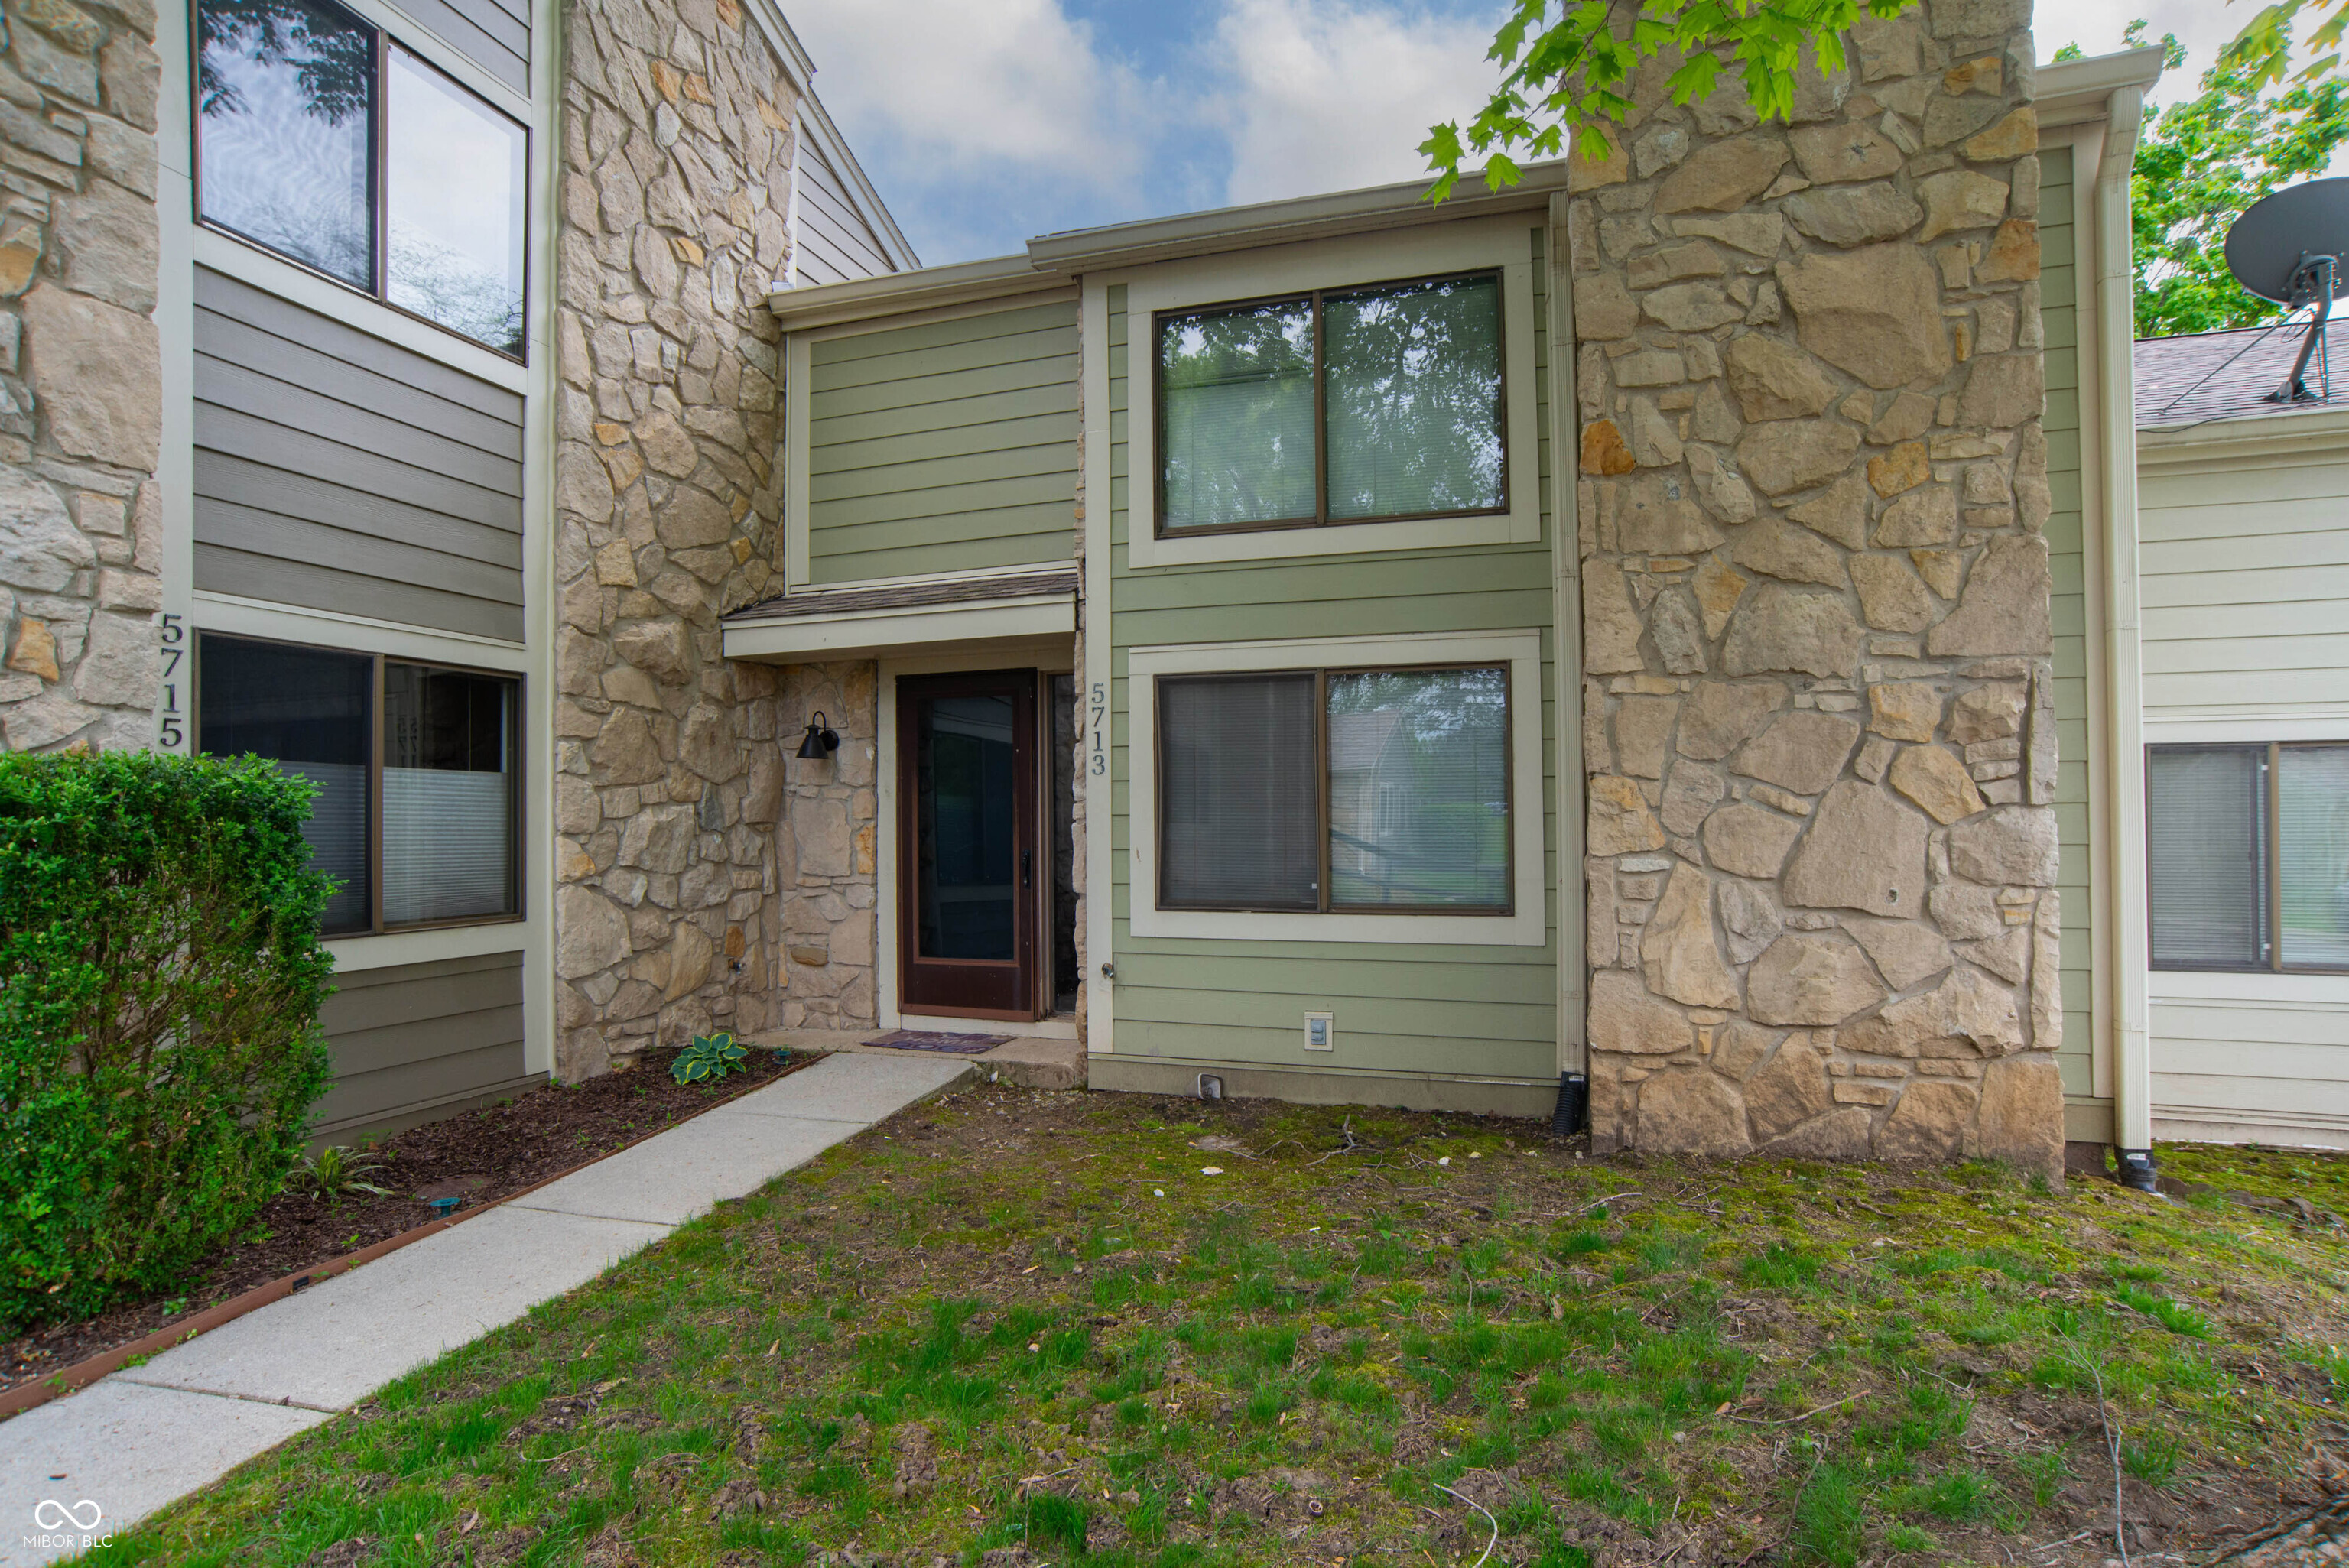
$172,500
2
bds
|
2
ba
|
1,080
sqft
|
built
1978
5713 Bradston Way, Indianapolis, IN 46237
$-191
Cash flow
-5.8%
Cash-on-Cash Return
4.8%
Cap rate
0.8%
Rent to Value Ratio

$350,000
4
bds
|
2
ba
|
2,000
sqft
|
built
1910
1641 English Ave, Indianapolis, IN 46201
$-827
Cash flow
-12.3%
Cash-on-Cash Return
3.3%
Cap rate
0.4%
Rent to Value Ratio
$238,999
3
bds
|
2
ba
|
1,250
sqft
|
built
1958
2350 Brewer Dr, Indianapolis, IN 46227
$-120
Cash flow
-2.6%
Cash-on-Cash Return
5.5%
Cap rate
0.7%
Rent to Value Ratio