Chicago, IL Investment Properties for Sale
Browse homes for sale and investment properties in Chicago, IL. Refine your search by price, property type, or more.
Best cash flowing properties in Chicago, IL

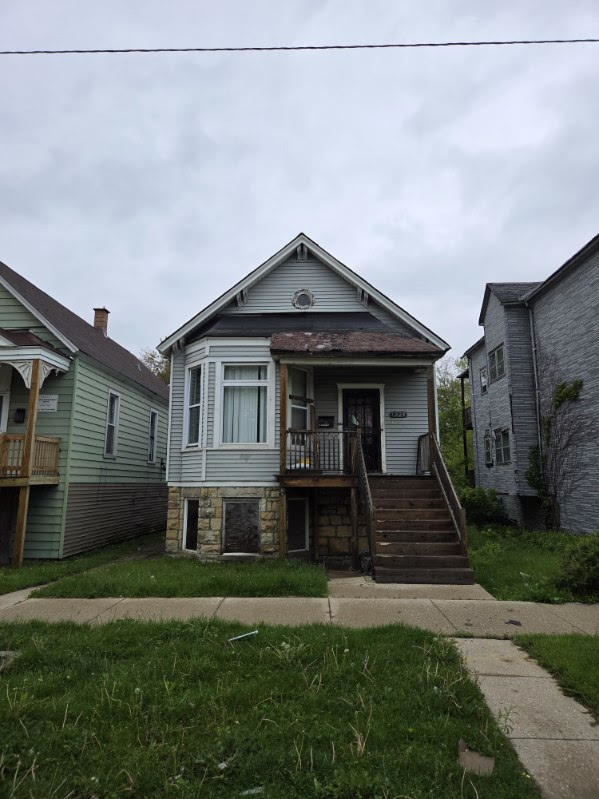
$59,900
5
bds
|
2
ba
|
0
sqft
|
built
1512
8548 S Marquette Ave, Chicago, IL 60617
$1,016
Cash flow
19.8%
Cash-on-Cash Return
20.4%
Cap rate
2.7%
Rent to Value Ratio
$64,900
3
bds
|
1
ba
|
1,300
sqft
|
built
1873
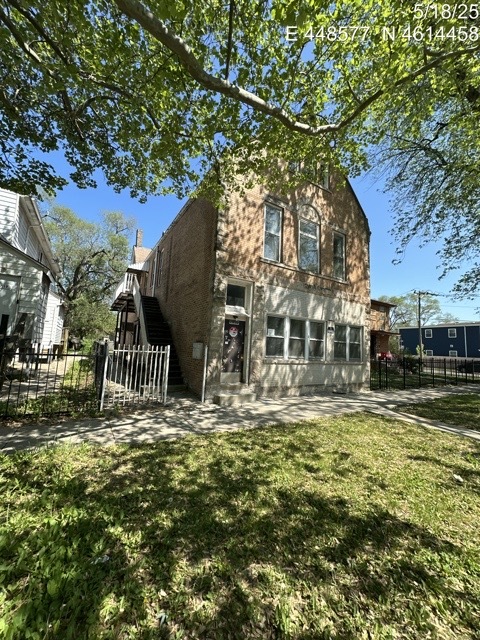
7828 S Escanaba Ave, Chicago, IL 60649
$998
Cash flow
17.9%
Cash-on-Cash Return
18.5%
Cap rate
2.5%
Rent to Value Ratio
3,723 out of 4,350 properties for sale in Chicago, IL
Limited Results Shown
Create a free account, or log in to reveal all property listings and enjoy the complete experience.
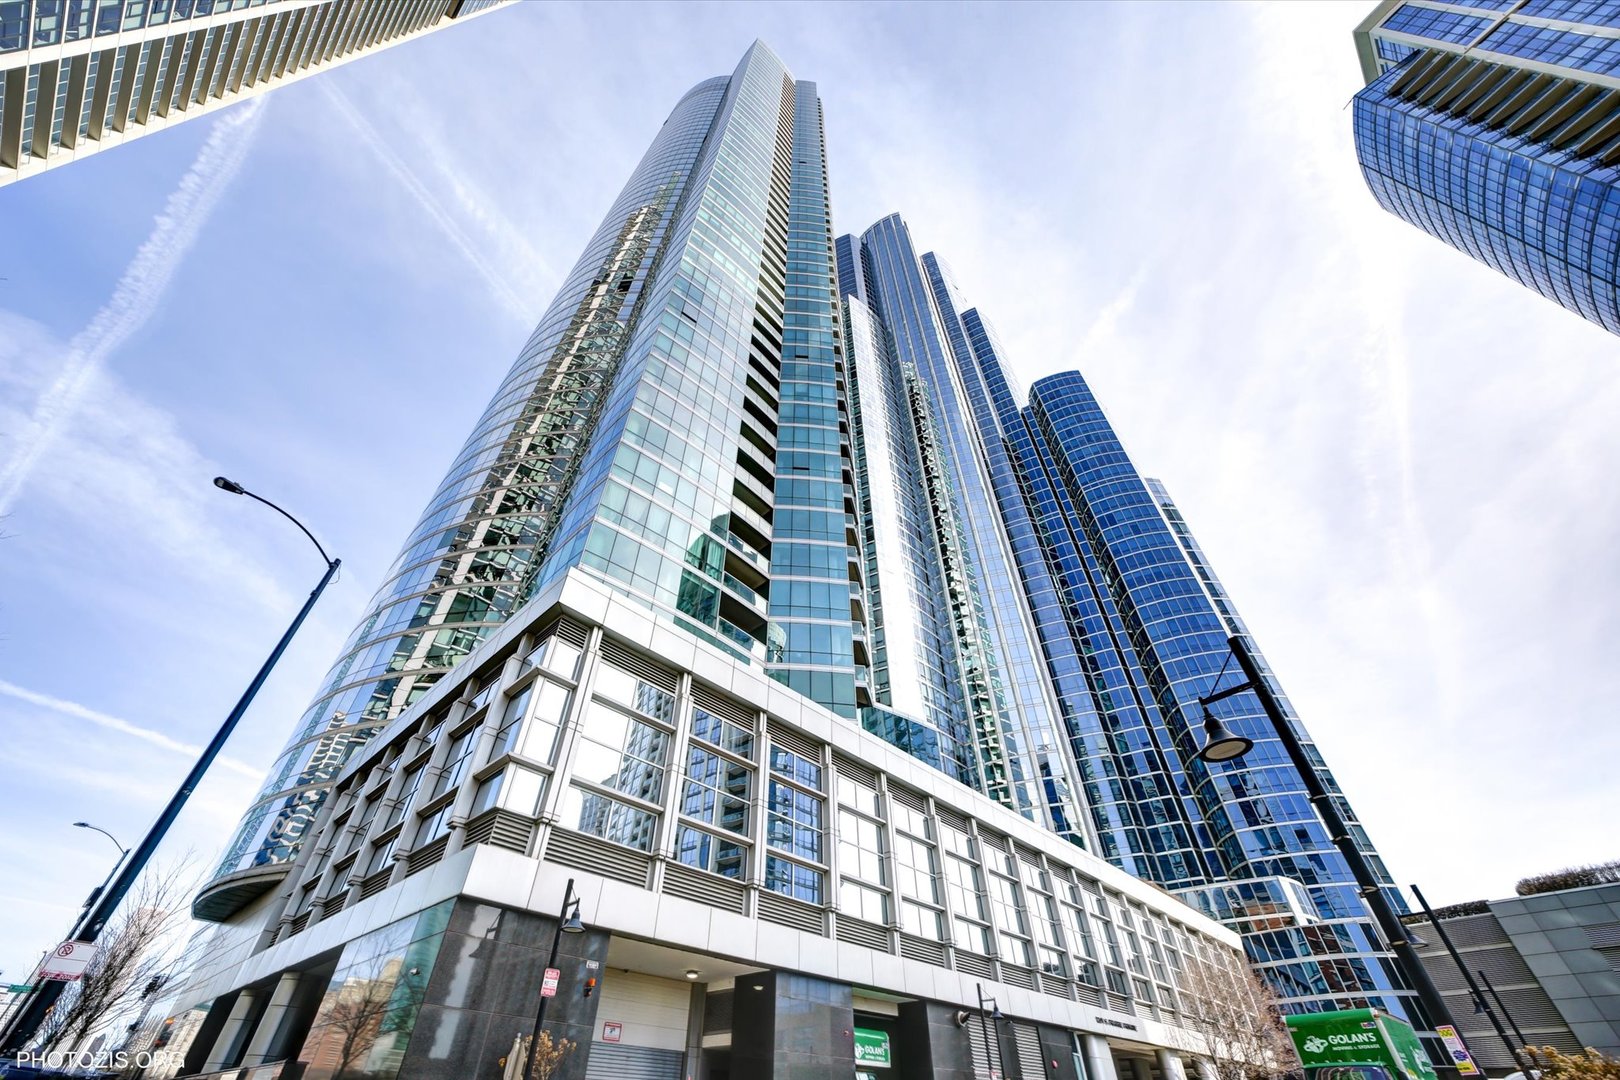
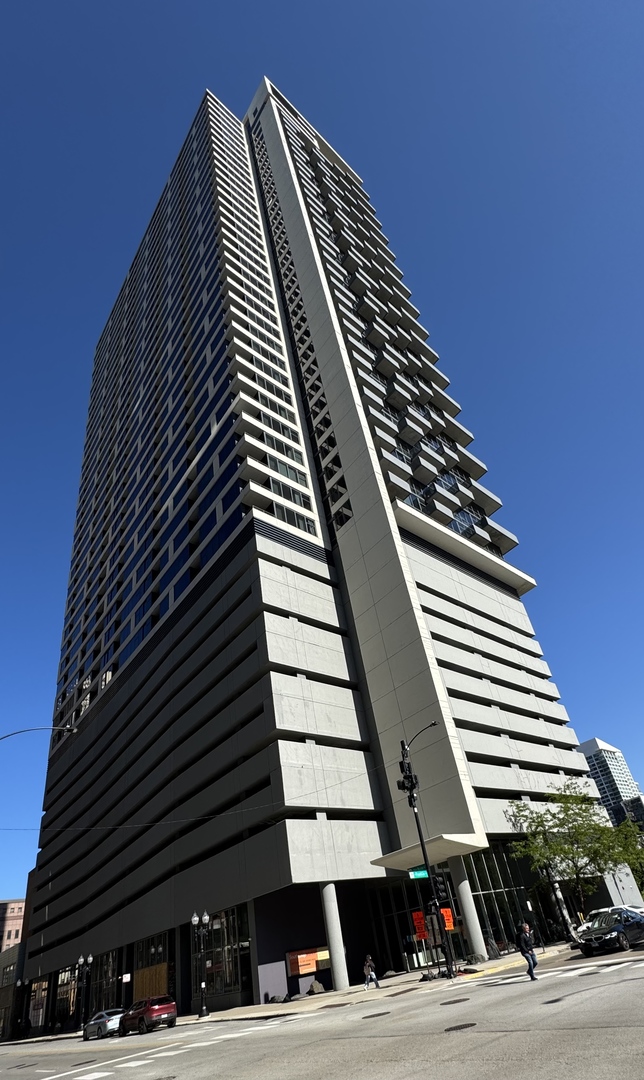
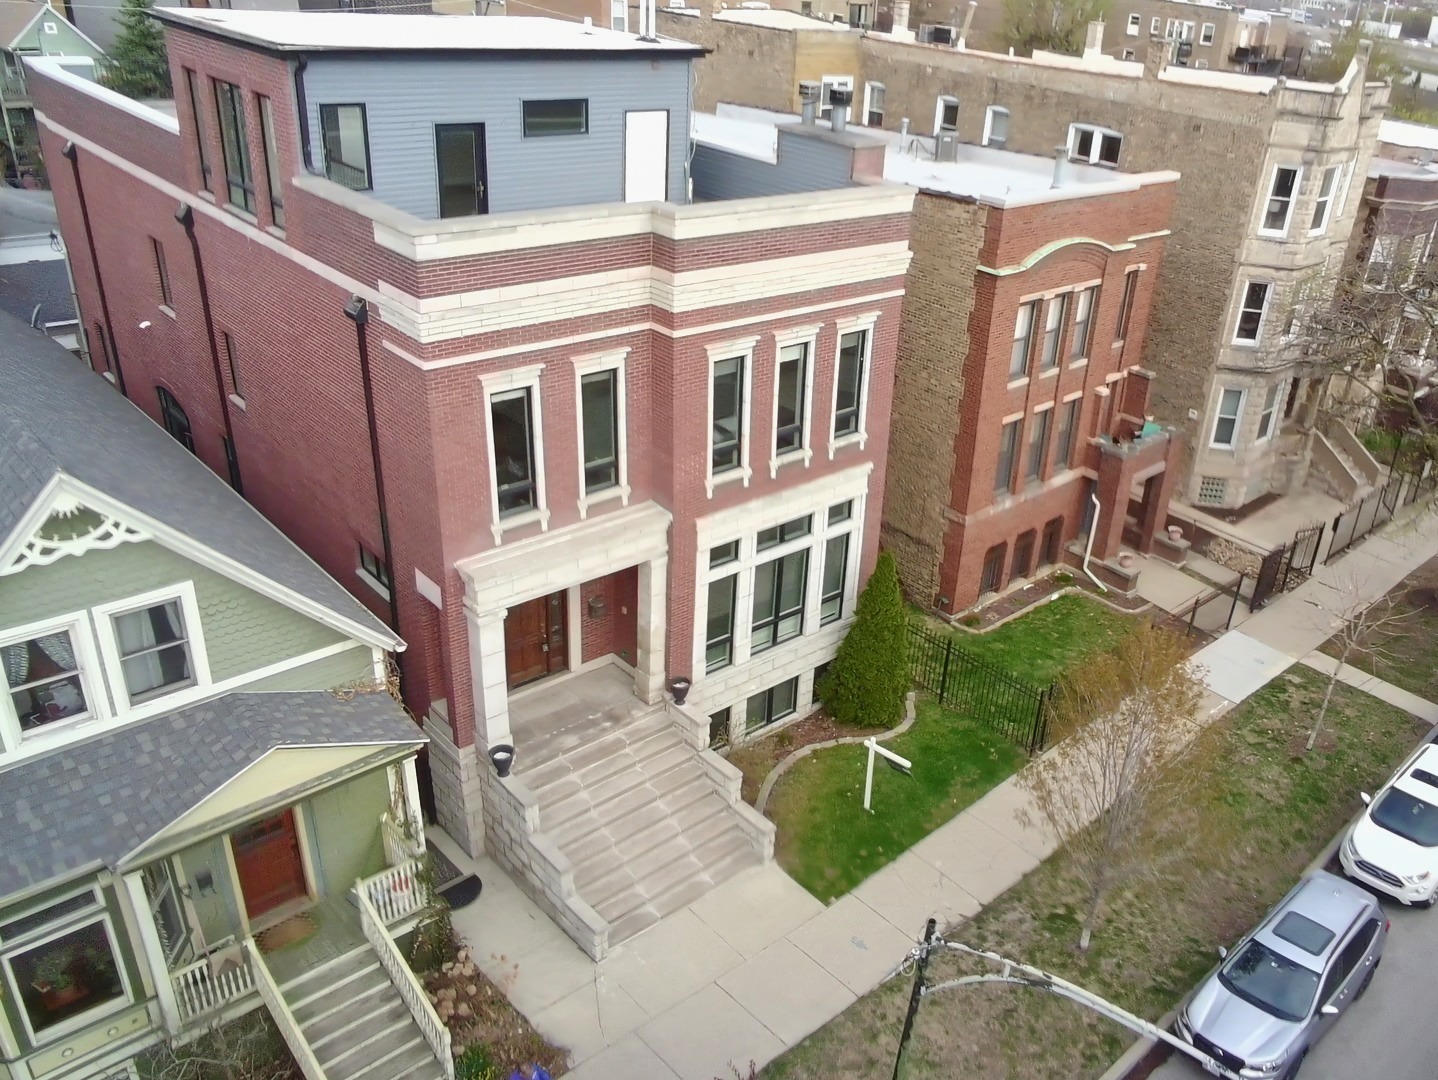
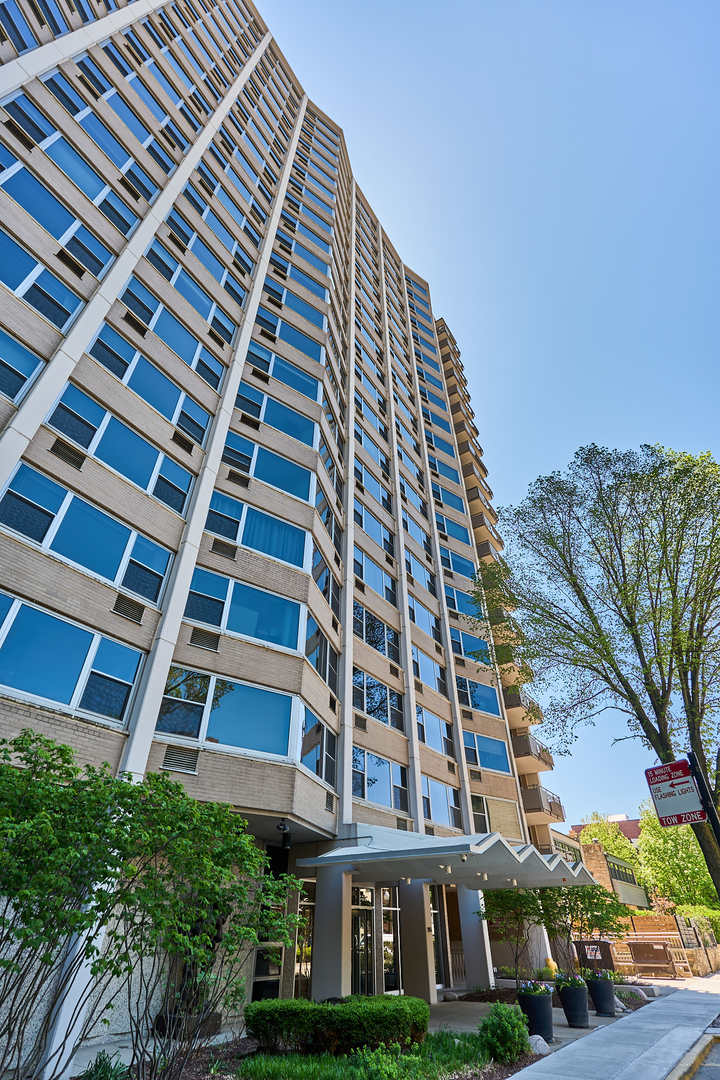
$785,000
2
bds
|
2
ba
|
1,639
sqft
|
built
2013
1201 S Prairie Ave, Chicago, IL 60605
$-2,599
Cash flow
-17.3%
Cash-on-Cash Return
1.7%
Cap rate
0.6%
Rent to Value Ratio
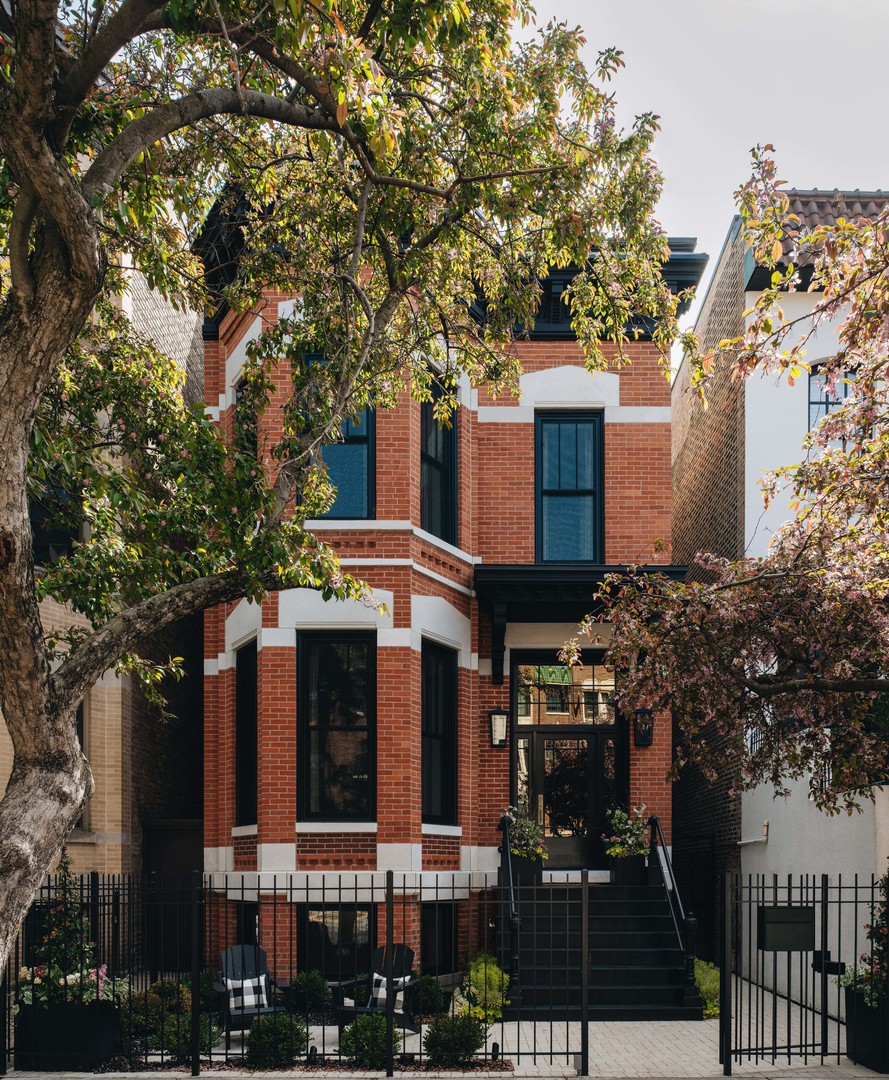
$5,575,000
5
bds
|
7
ba
|
0
sqft
|
built
1890
1823 N Lincoln Park W, Chicago, IL 60614
$-24,509
Cash flow
-22.9%
Cash-on-Cash Return
0.4%
Cap rate
0.1%
Rent to Value Ratio
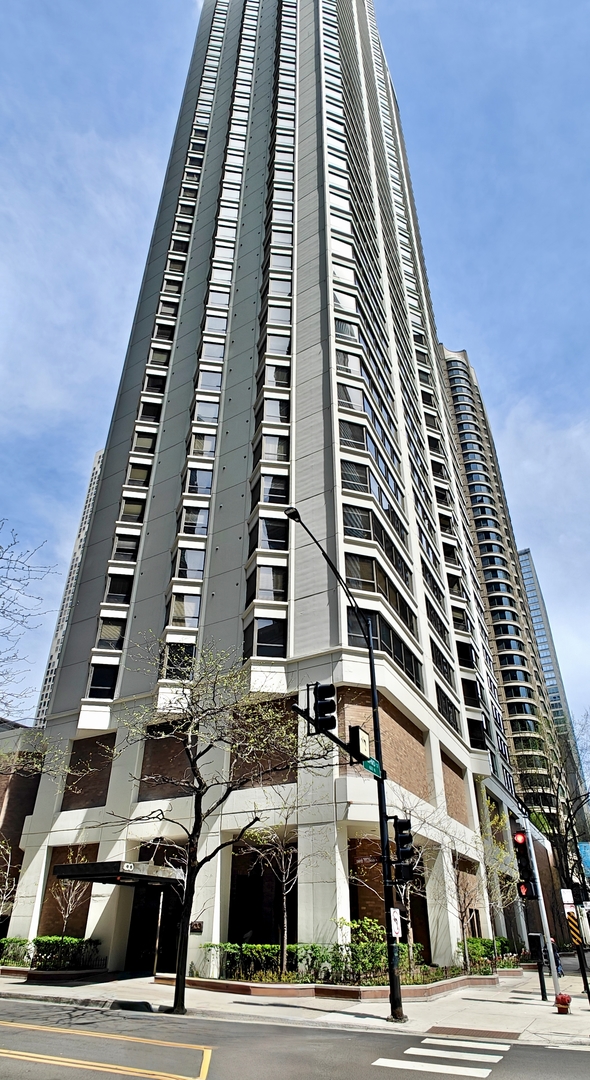
$699,000
2
bds
|
2
ba
|
1,650
sqft
|
built
1983
400 E Ohio St, Chicago, IL 60611
$-3,087
Cash flow
-23.0%
Cash-on-Cash Return
0.4%
Cap rate
0.5%
Rent to Value Ratio

$550,000
10
bds
|
6
ba
|
0
sqft
|
built
1914
2853 W 40th St, Chicago, IL 60632
$-2,038
Cash flow
-19.3%
Cash-on-Cash Return
1.2%
Cap rate
0.4%
Rent to Value Ratio
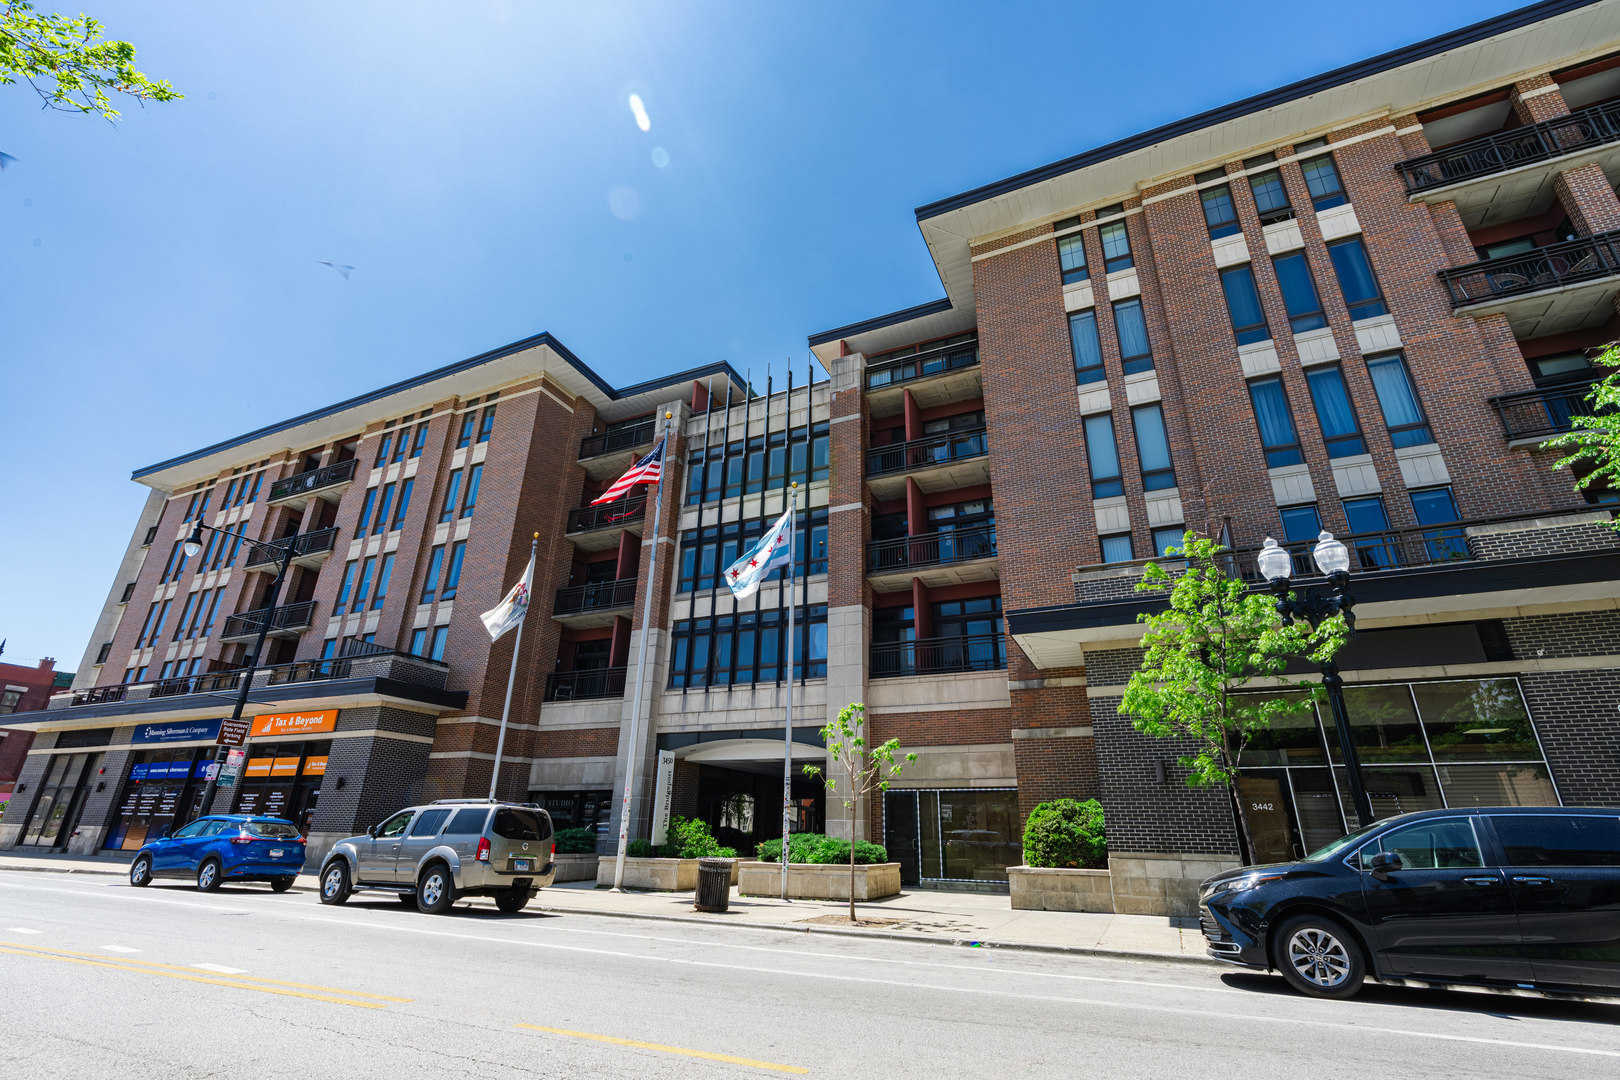
$310,000
2
bds
|
2
ba
|
1,163
sqft
|
built
2007
3450 S Halsted St, Chicago, IL 60608
$-532
Cash flow
-9.0%
Cash-on-Cash Return
3.6%
Cap rate
0.9%
Rent to Value Ratio
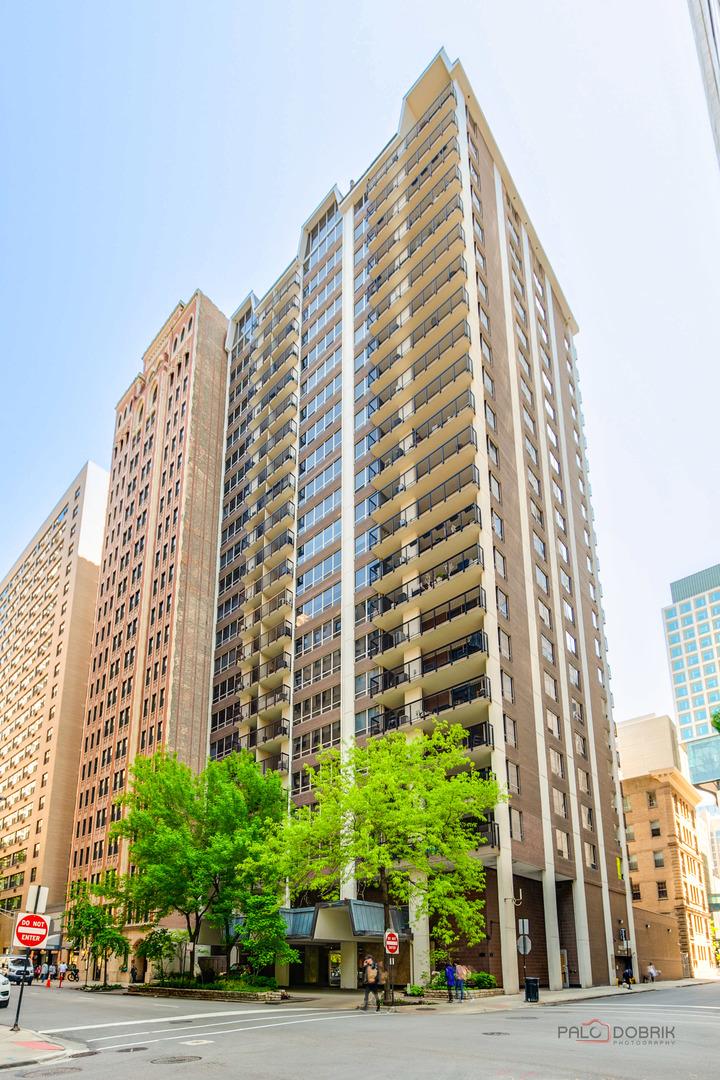
$285,000
1
bds
|
1
ba
|
1,050
sqft
|
built
1966
201 E Chestnut St, Chicago, IL 60611
$-587
Cash flow
-10.7%
Cash-on-Cash Return
3.2%
Cap rate
0.9%
Rent to Value Ratio
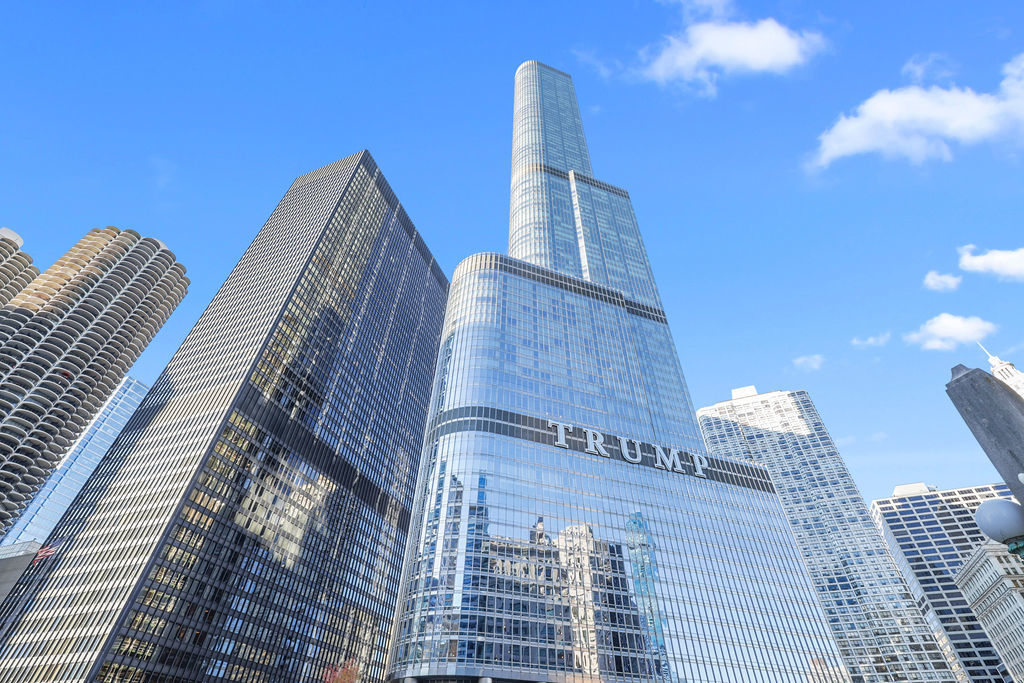
$579,000
1
bds
|
2
ba
|
938
sqft
|
built
2008
401 N Wabash Ave, Chicago, IL 60611
$-2,069
Cash flow
-18.6%
Cash-on-Cash Return
1.4%
Cap rate
0.6%
Rent to Value Ratio

$269,900
3
bds
|
3
ba
|
735
sqft
|
built
1921
5648 S California Ave, Chicago, IL 60629
$80
Cash flow
1.5%
Cash-on-Cash Return
6.0%
Cap rate
0.9%
Rent to Value Ratio
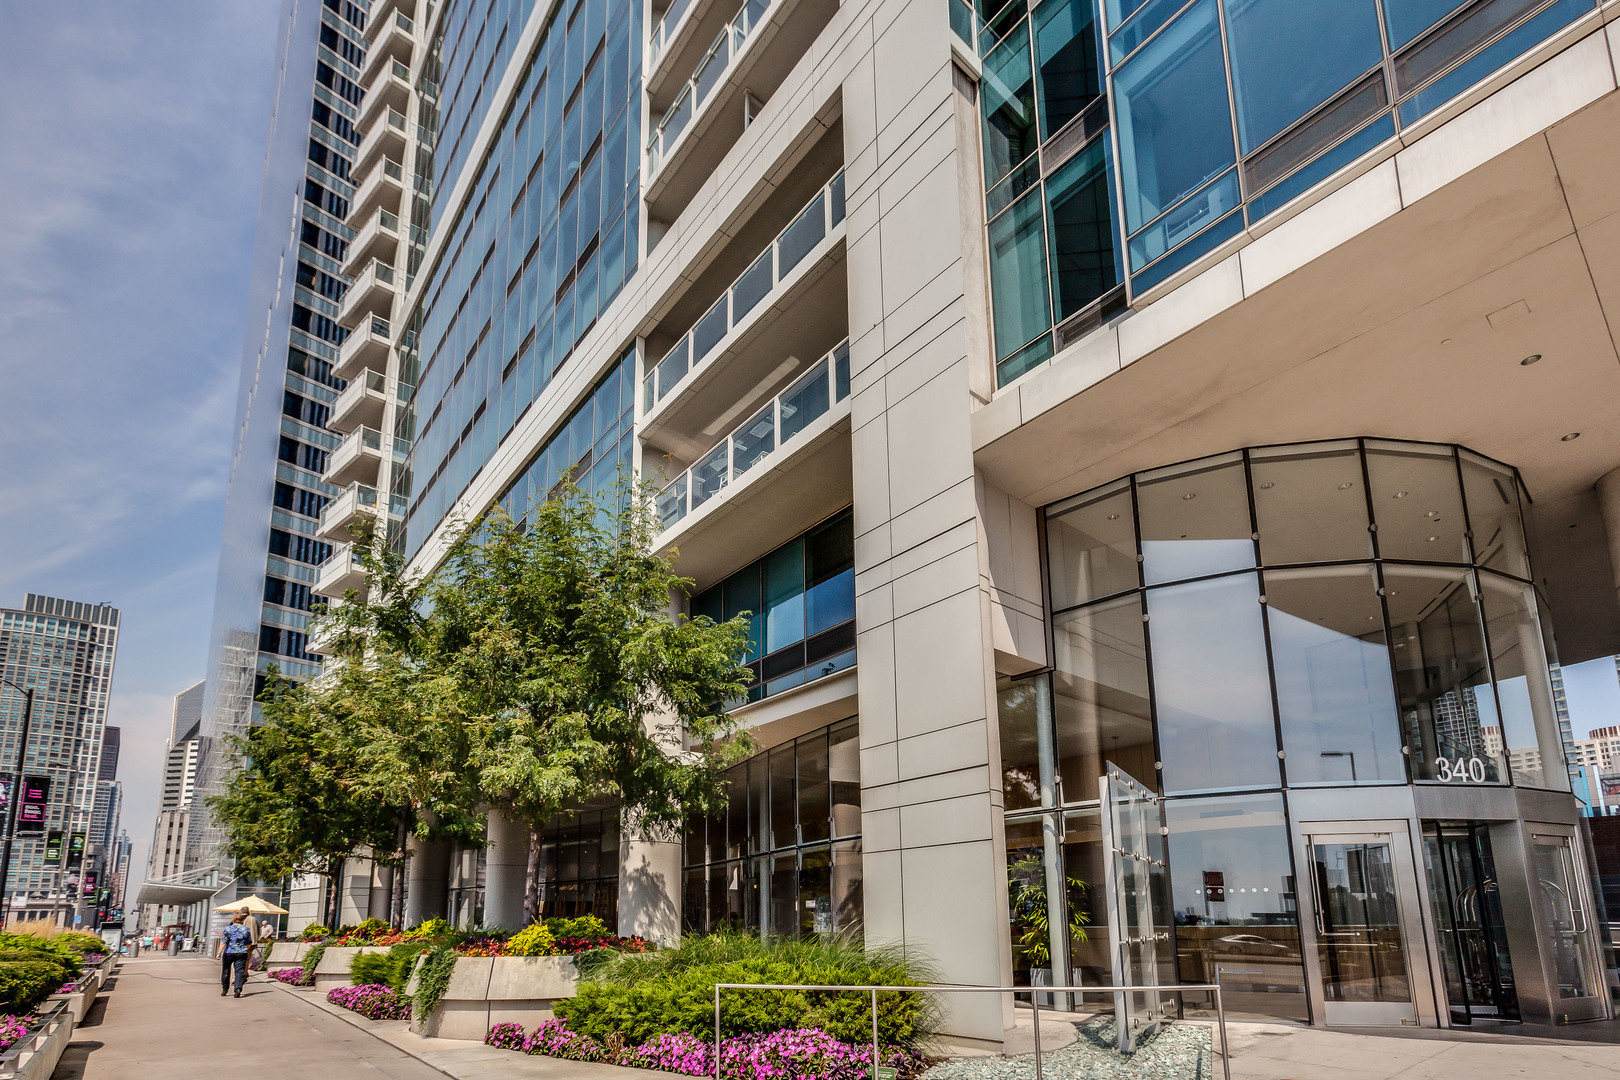
$925,000
2
bds
|
3
ba
|
1,902
sqft
|
built
2007
340 E Randolph St, Chicago, IL 60601
$-3,142
Cash flow
-17.7%
Cash-on-Cash Return
1.6%
Cap rate
0.7%
Rent to Value Ratio
$65,000
1
bds
|
1
ba
|
500
sqft
|
built
1975
7854 S South Shore Dr, Chicago, IL 60649
$243
Cash flow
4.4%
Cash-on-Cash Return
4.5%
Cap rate
1.5%
Rent to Value Ratio
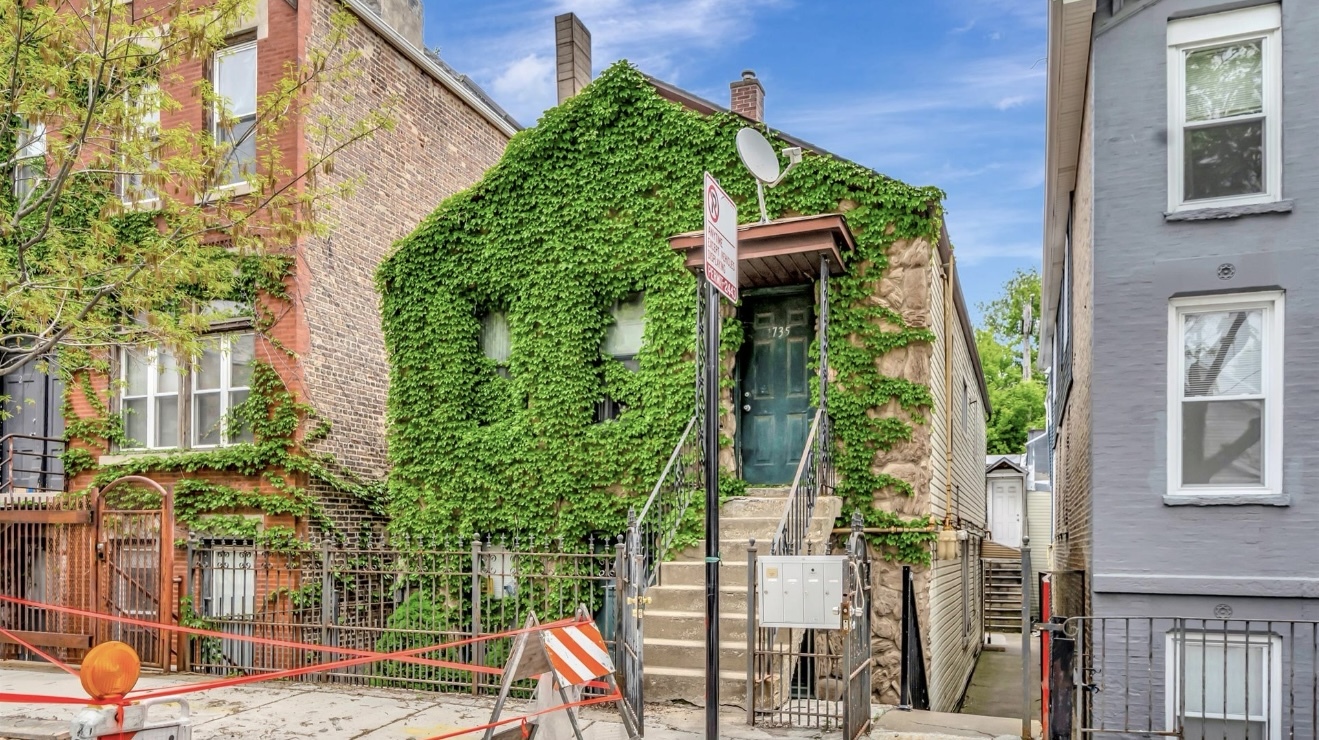
$749,900
6
bds
|
4
ba
|
0
sqft
|
built
1888
1735 S Desplaines St, Chicago, IL 60616
$-2,443
Cash flow
-17.0%
Cash-on-Cash Return
1.8%
Cap rate
0.4%
Rent to Value Ratio
$59,900
5
bds
|
2
ba
|
0
sqft
|
built
1512
8548 S Marquette Ave, Chicago, IL 60617
$1,016
Cash flow
19.8%
Cash-on-Cash Return
20.4%
Cap rate
2.7%
Rent to Value Ratio
$370,000
2
bds
|
2
ba
|
969
sqft
|
built
2009
235 W Van Buren St, Chicago, IL 60607
$-1,107
Cash flow
-15.6%
Cash-on-Cash Return
2.1%
Cap rate
0.7%
Rent to Value Ratio
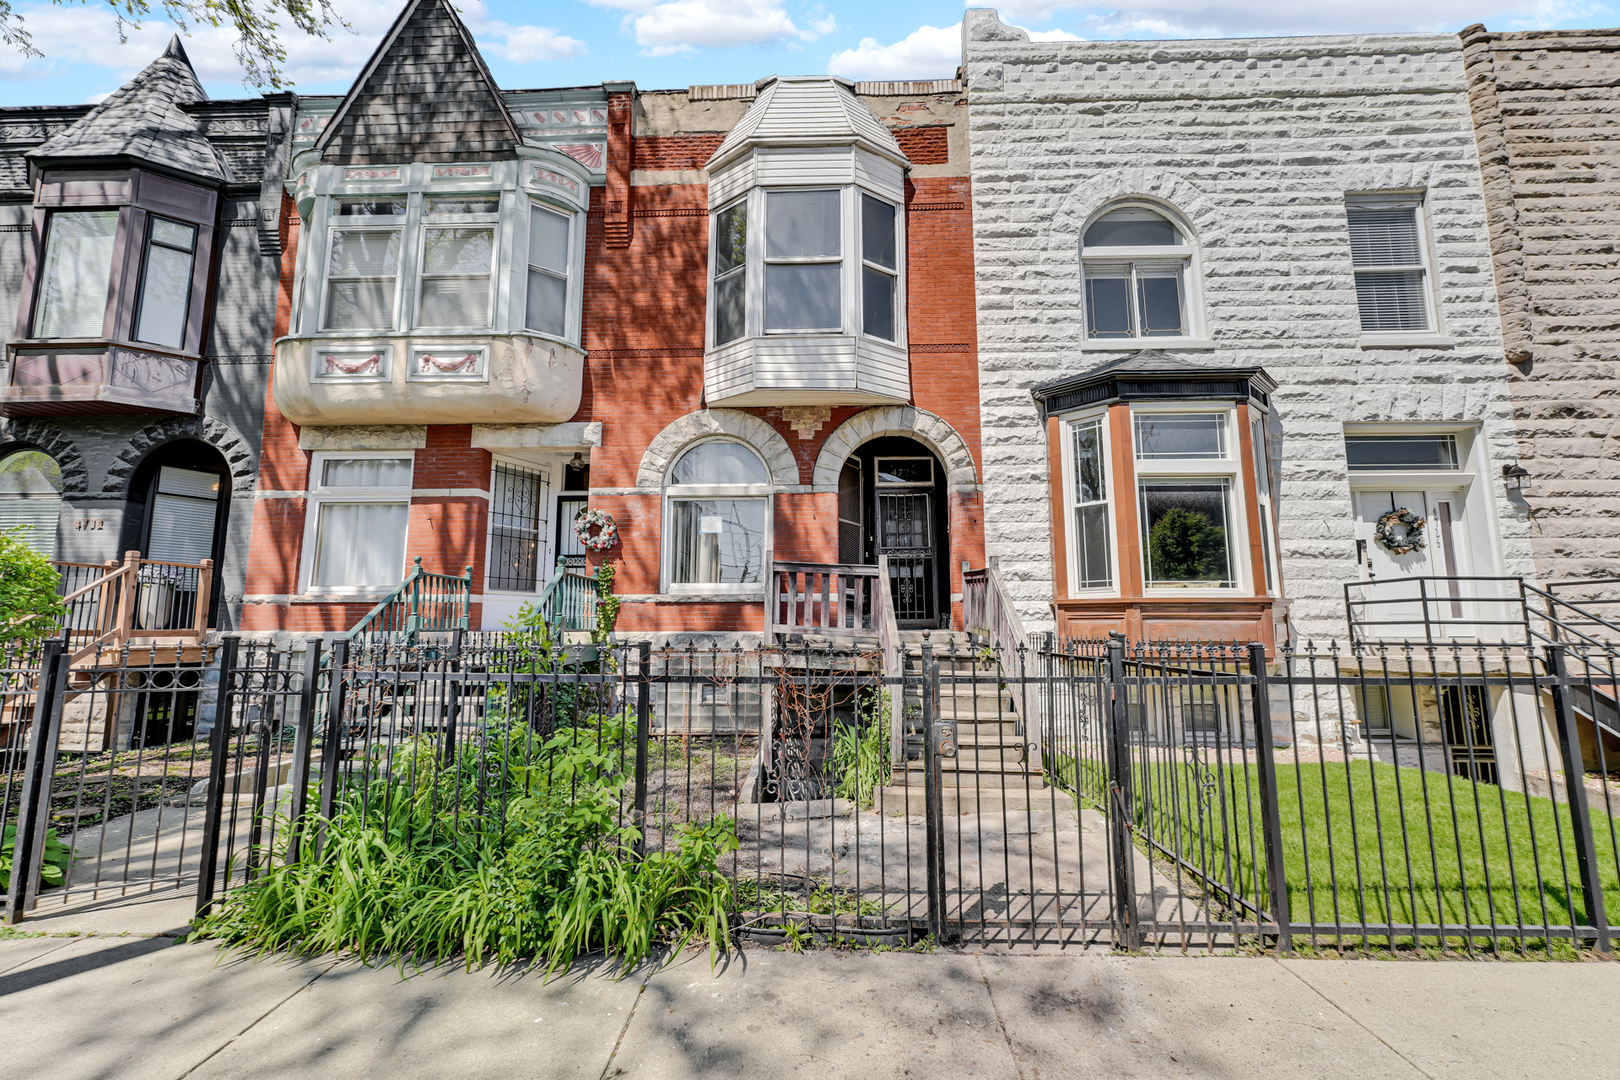
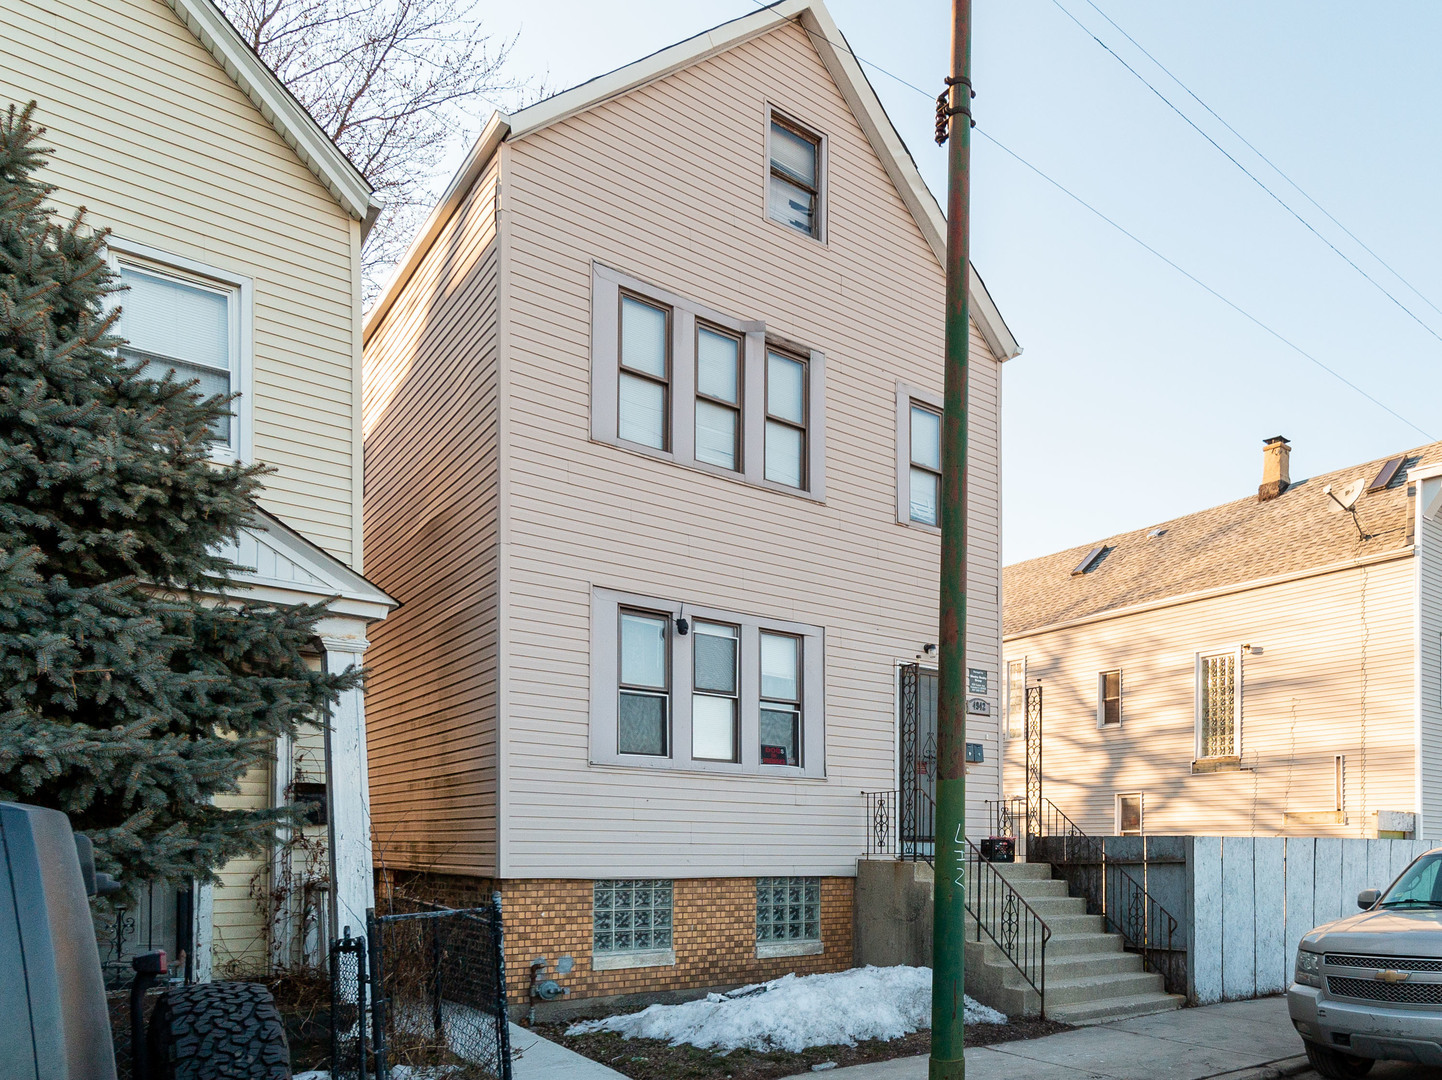
$249,900
4
bds
|
2
ba
|
1,818
sqft
|
built
1886
4728 S Evans Ave, Chicago, IL 60615
$515
Cash flow
10.8%
Cash-on-Cash Return
8.2%
Cap rate
1.2%
Rent to Value Ratio
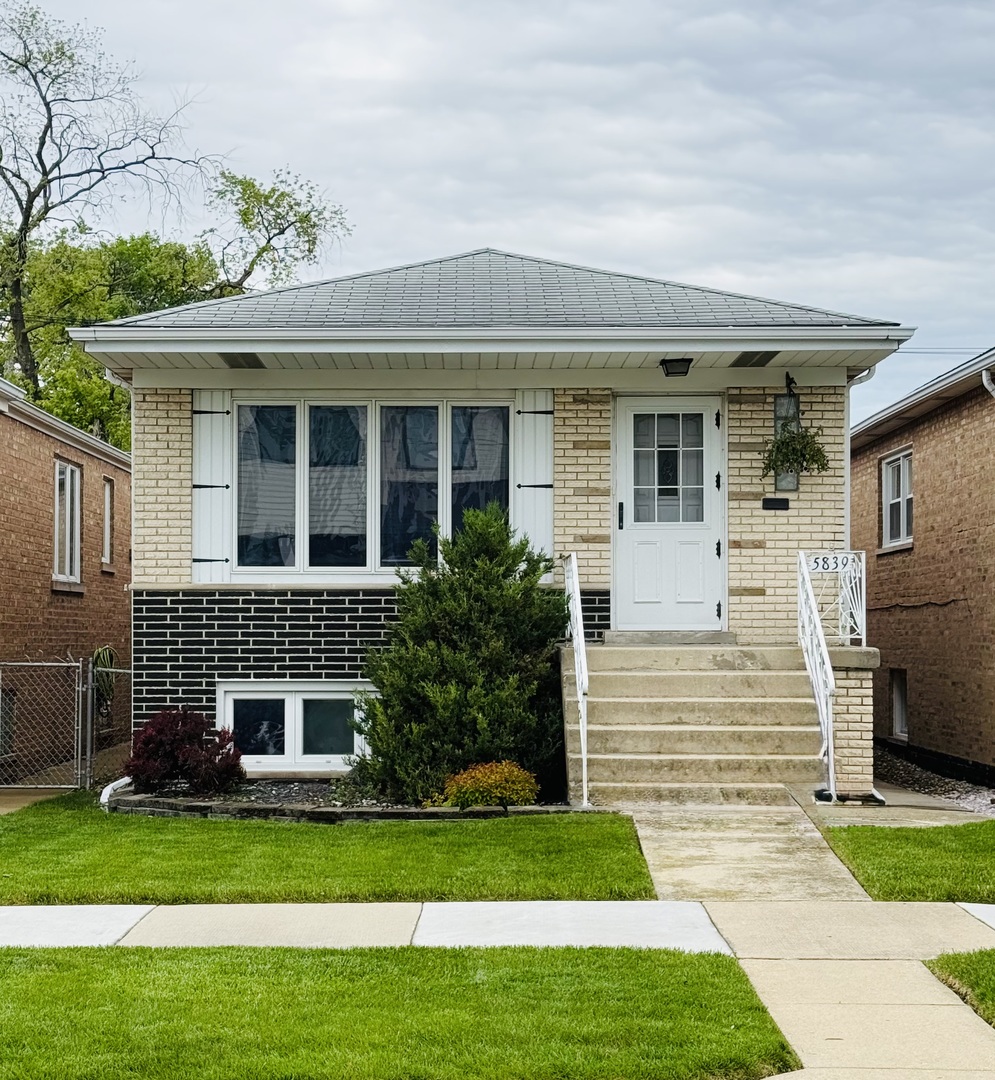
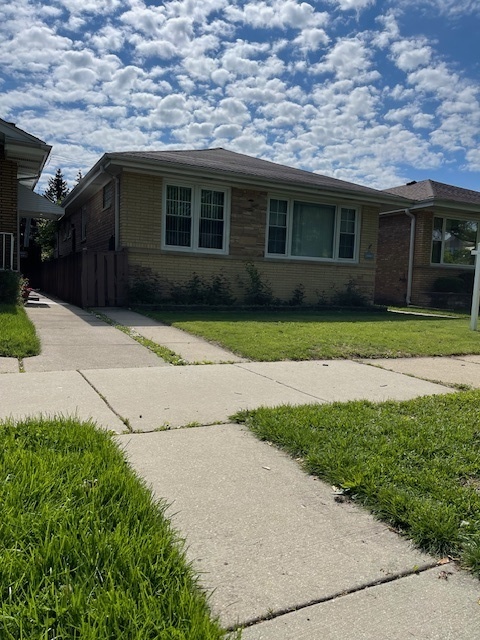
$359,900
3
bds
|
2
ba
|
1,120
sqft
|
built
1971
5839 S Newland Ave, Chicago, IL 60638
$-90
Cash flow
-1.3%
Cash-on-Cash Return
5.4%
Cap rate
0.8%
Rent to Value Ratio
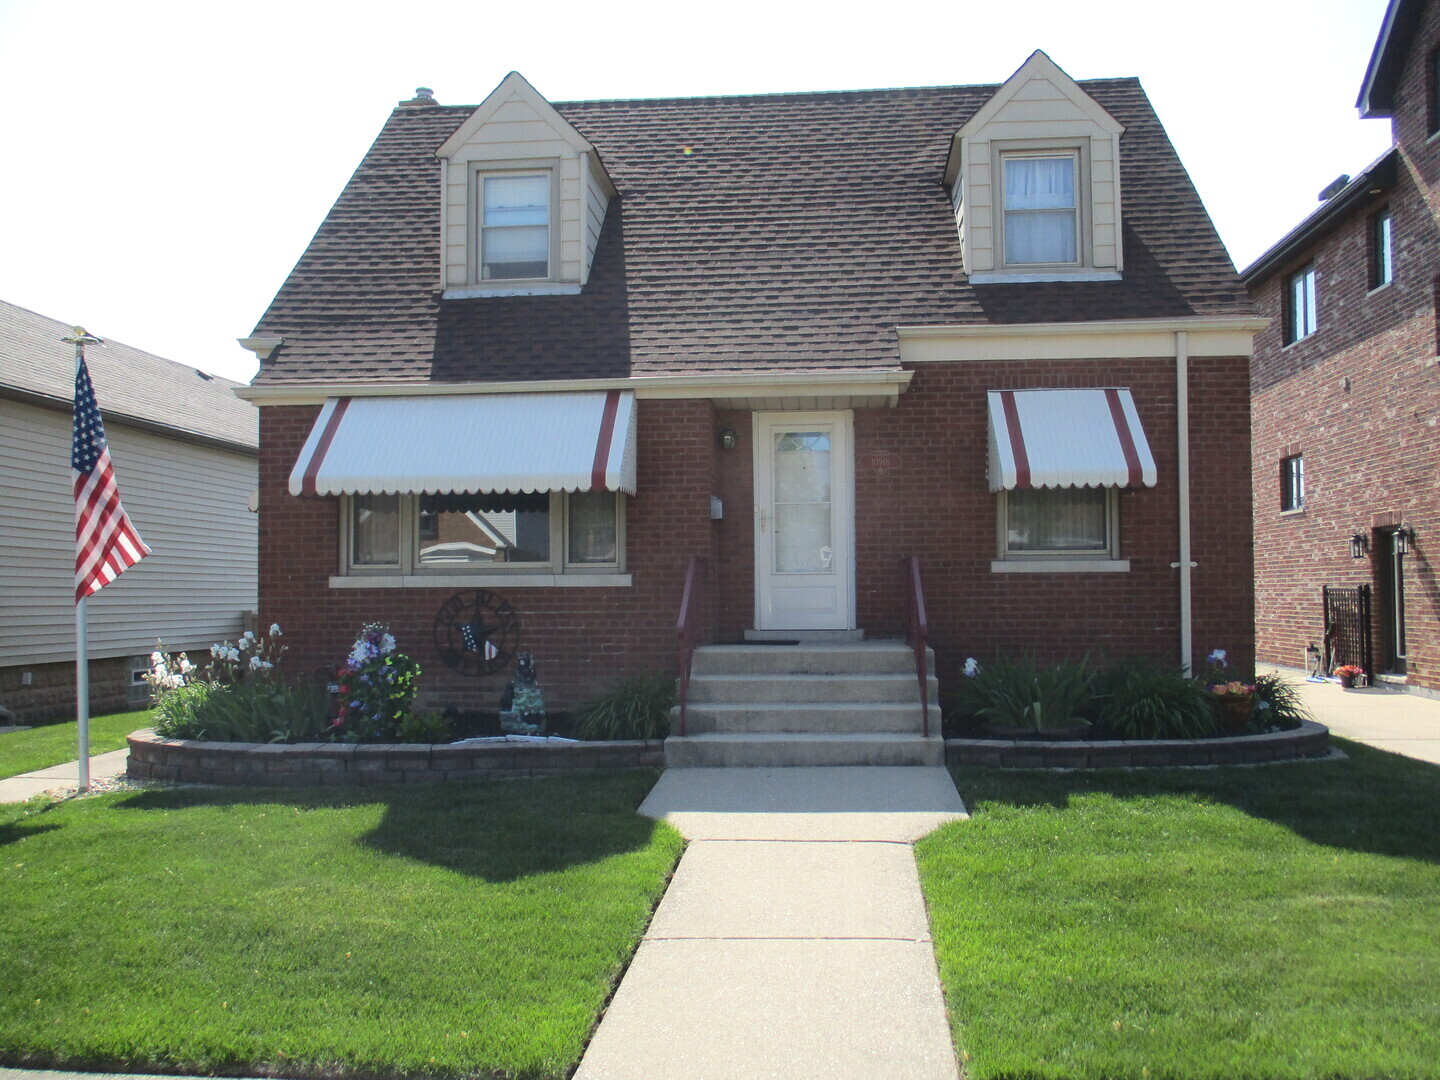
$342,500
3
bds
|
2
ba
|
0
sqft
|
built
1949
10918 S Ridgeway Ave, Chicago, IL 60655
$-179
Cash flow
-2.7%
Cash-on-Cash Return
5.1%
Cap rate
0.7%
Rent to Value Ratio
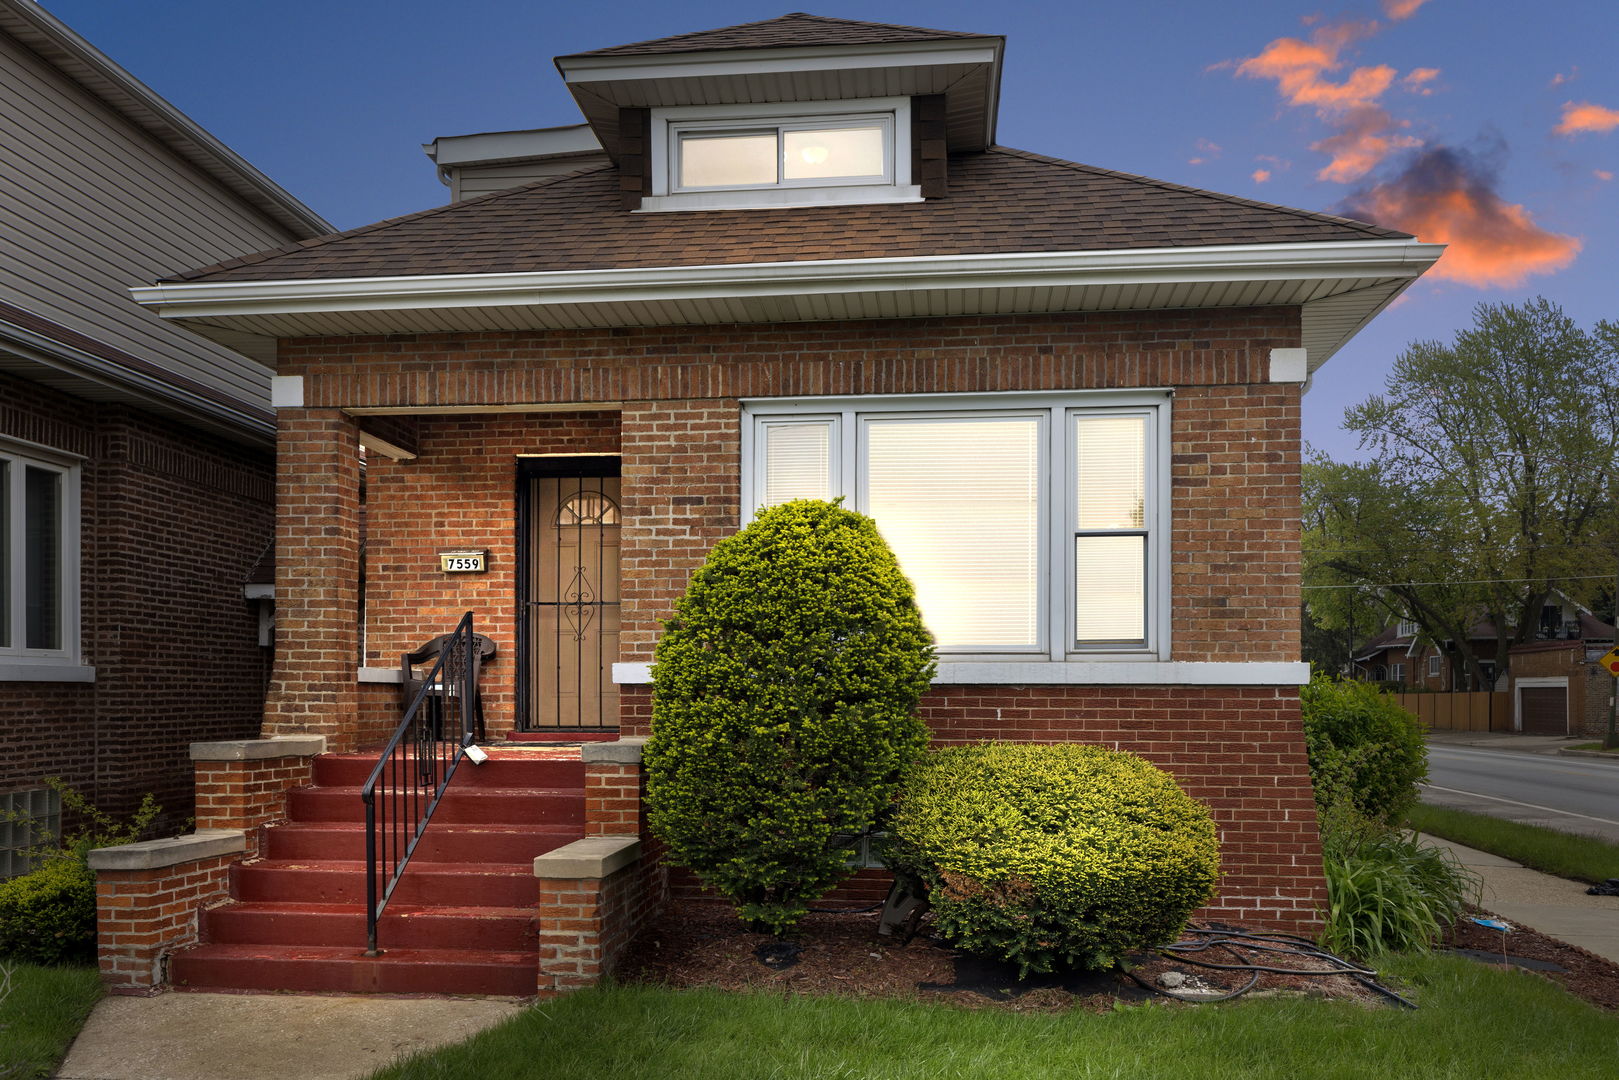
$345,000
4
bds
|
3
ba
|
2,800
sqft
|
built
1917
7559 S Michigan Ave, Chicago, IL 60619
$519
Cash flow
7.8%
Cash-on-Cash Return
7.5%
Cap rate
1.0%
Rent to Value Ratio
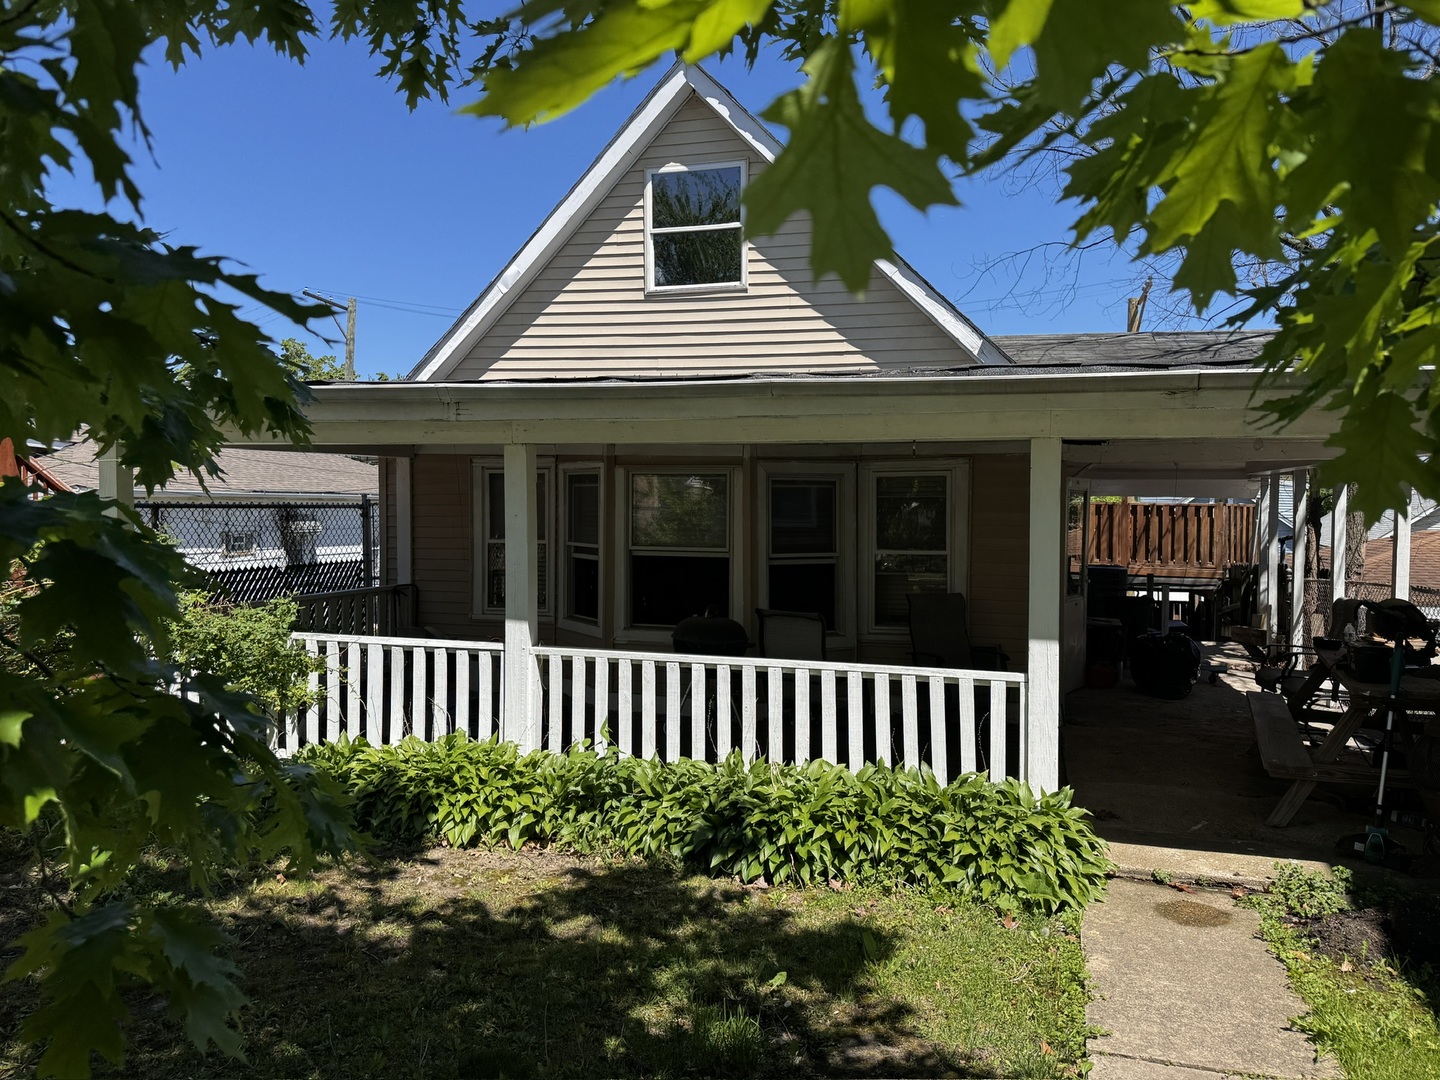
$64,900
3
bds
|
1
ba
|
1,300
sqft
|
built
1873
7828 S Escanaba Ave, Chicago, IL 60649
$998
Cash flow
17.9%
Cash-on-Cash Return
18.5%
Cap rate
2.5%
Rent to Value Ratio
$258,000
2
bds
|
2
ba
|
1,254
sqft
|
built
1923
2177 N Merrimac Ave, Chicago, IL 60639
$340
Cash flow
6.9%
Cash-on-Cash Return
7.3%
Cap rate
1.0%
Rent to Value Ratio

$419,999
5
bds
|
2
ba
|
3,523
sqft
|
built
1925
5823 S Francisco Ave, Chicago, IL 60629
$-976
Cash flow
-12.1%
Cash-on-Cash Return
2.9%
Cap rate
0.4%
Rent to Value Ratio
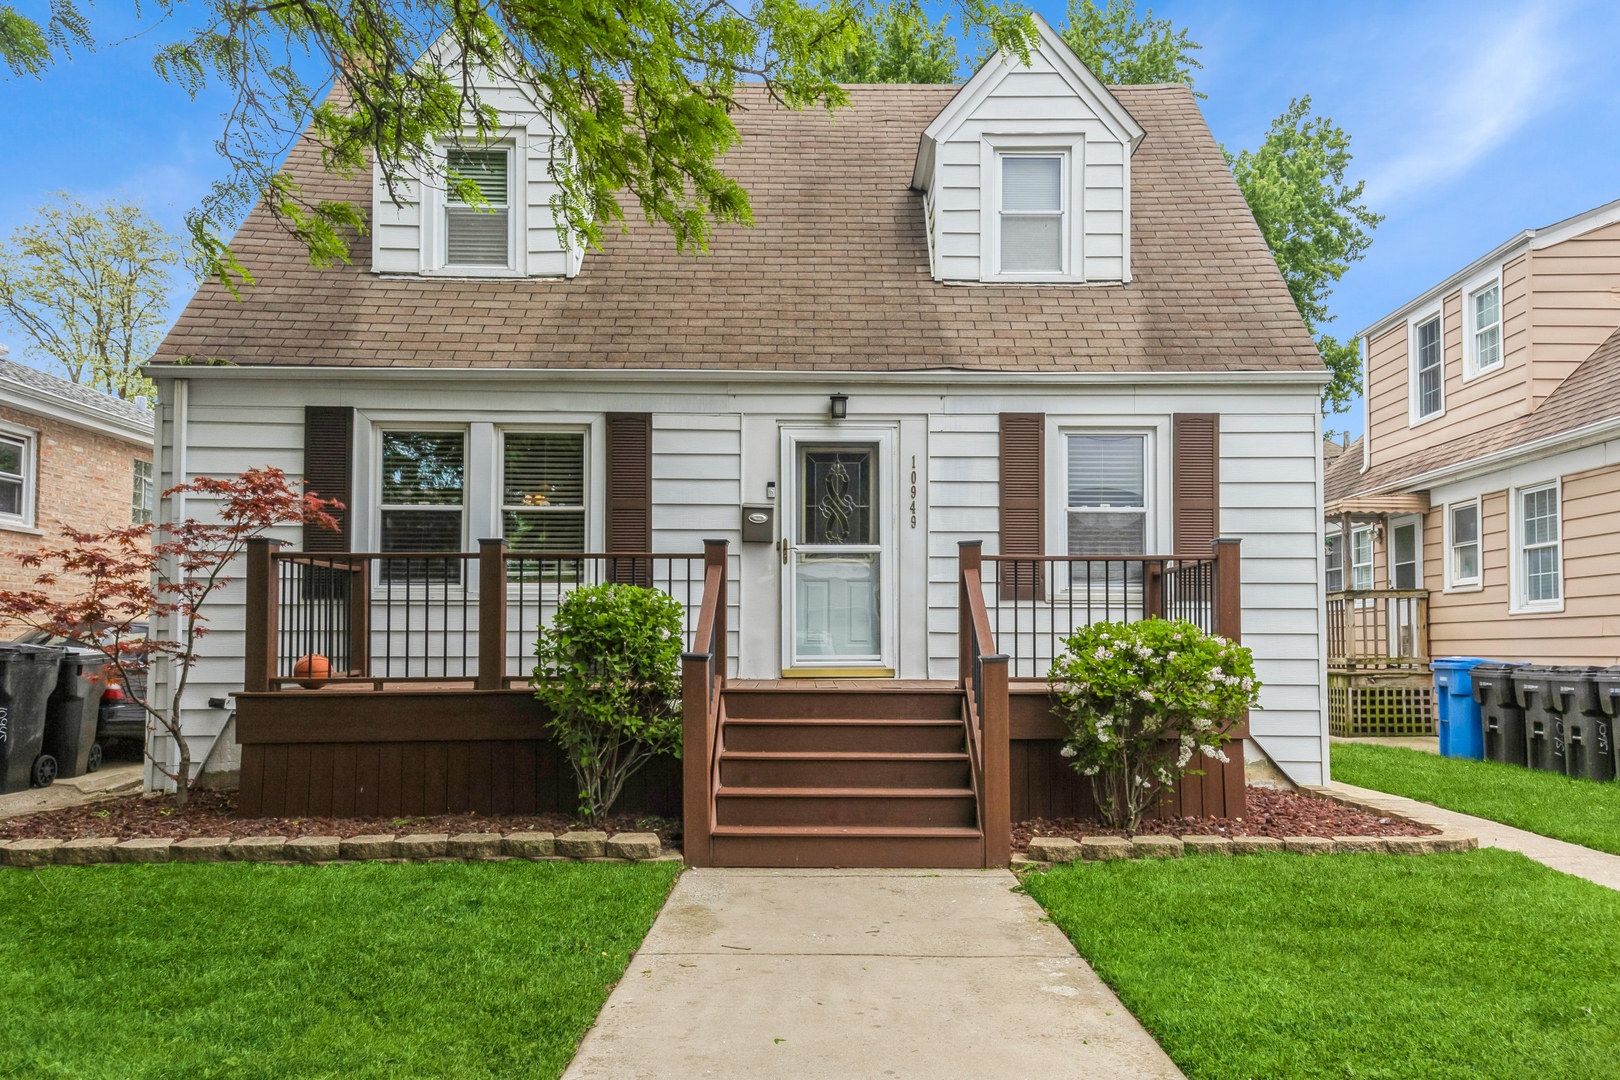
$299,900
3
bds
|
1
ba
|
0
sqft
|
built
1941
10949 S Homan Ave, Chicago, IL 60655
$-218
Cash flow
-3.8%
Cash-on-Cash Return
4.8%
Cap rate
0.7%
Rent to Value Ratio
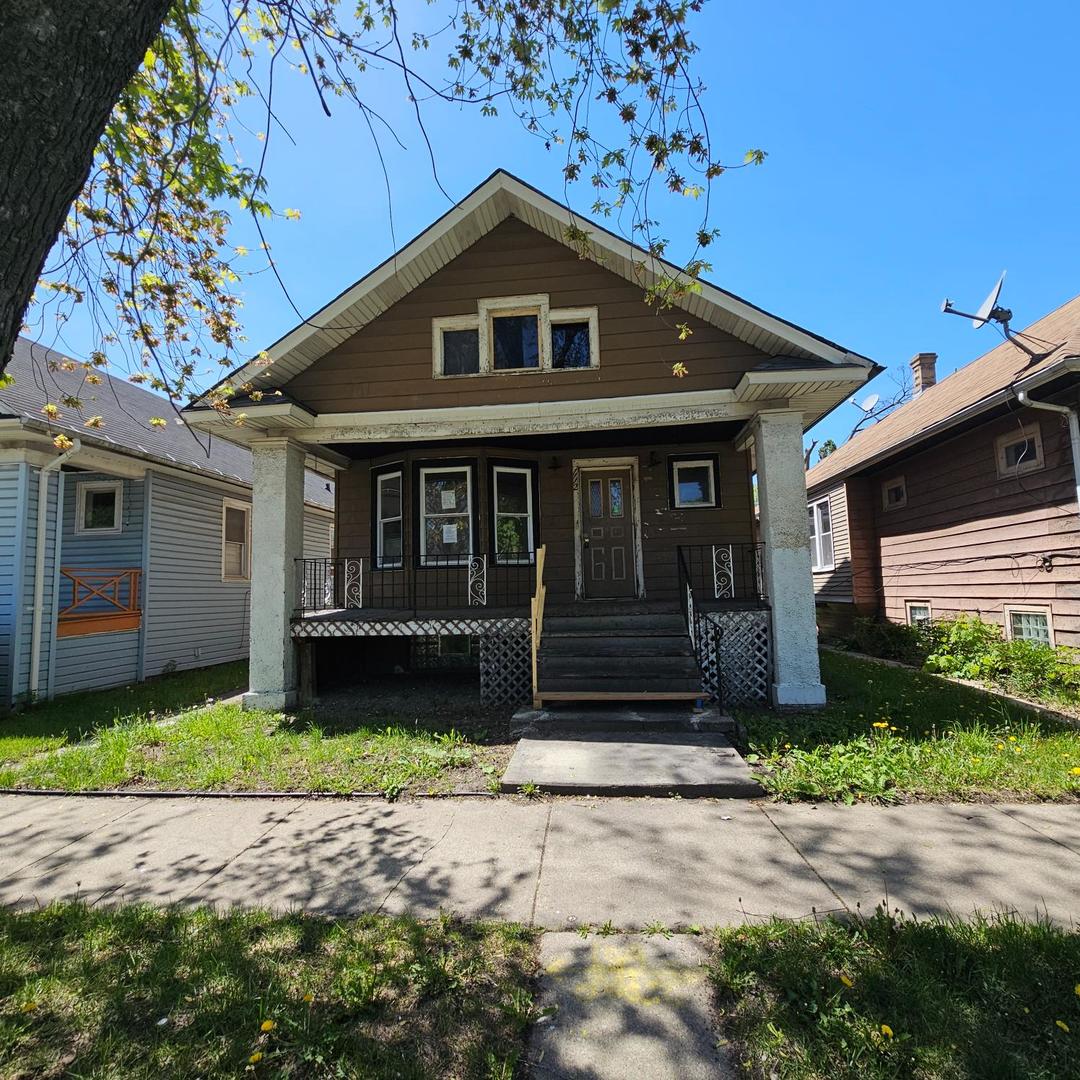
$135,000
4
bds
|
2
ba
|
1,542
sqft
|
built
1920
1112 N Monitor Ave, Chicago, IL 60651
$752
Cash flow
29.1%
Cash-on-Cash Return
12.4%
Cap rate
1.9%
Rent to Value Ratio
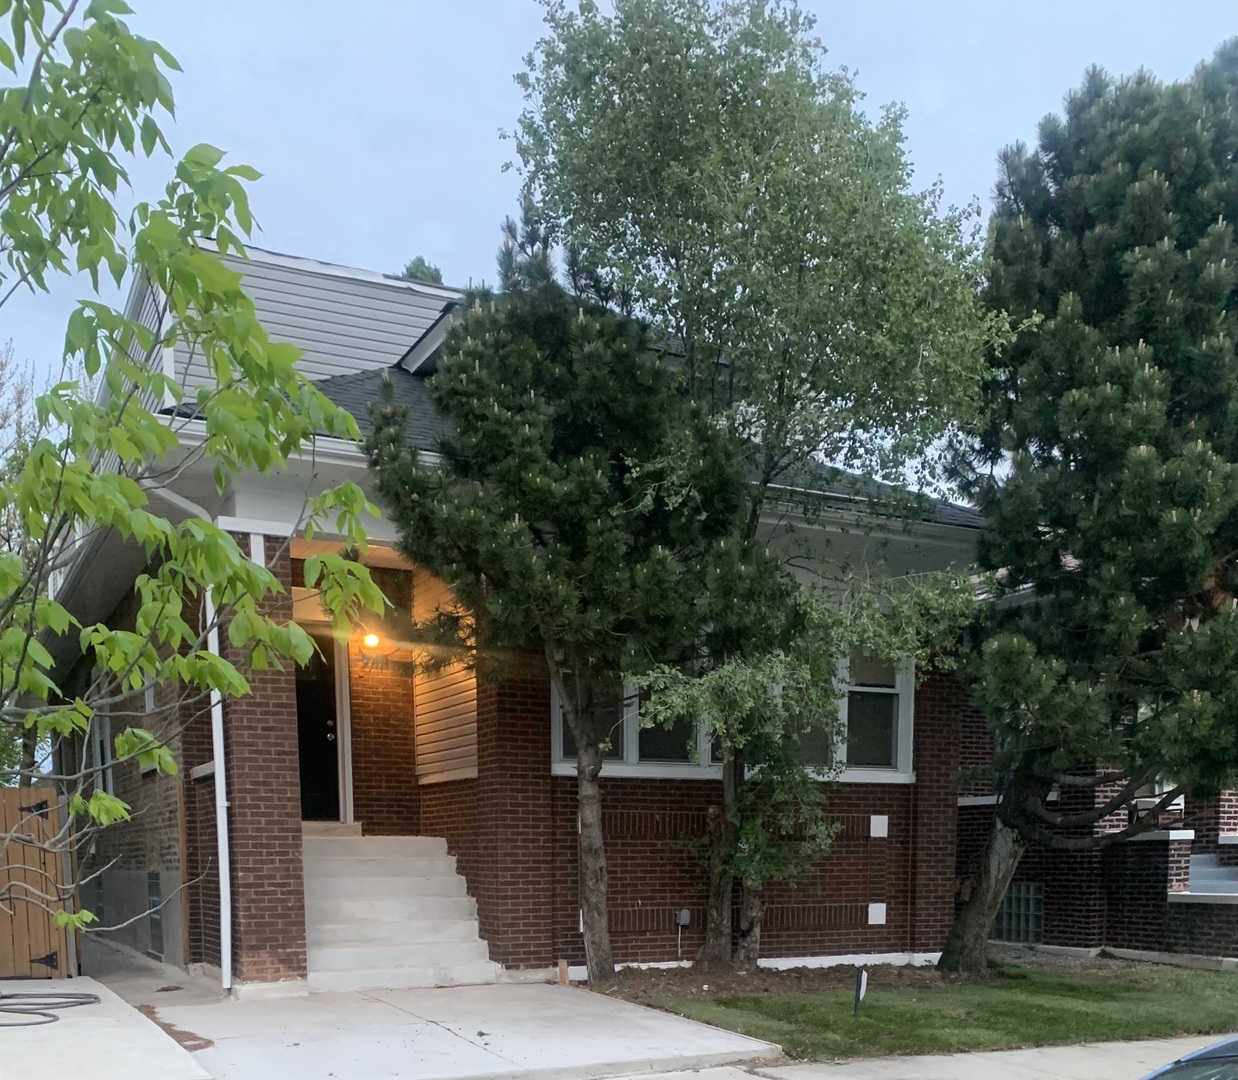
$349,900
8
bds
|
3
ba
|
3,300
sqft
|
built
1957
8019 S Bishop St, Chicago, IL 60620
$-400
Cash flow
-6.0%
Cash-on-Cash Return
4.3%
Cap rate
0.6%
Rent to Value Ratio
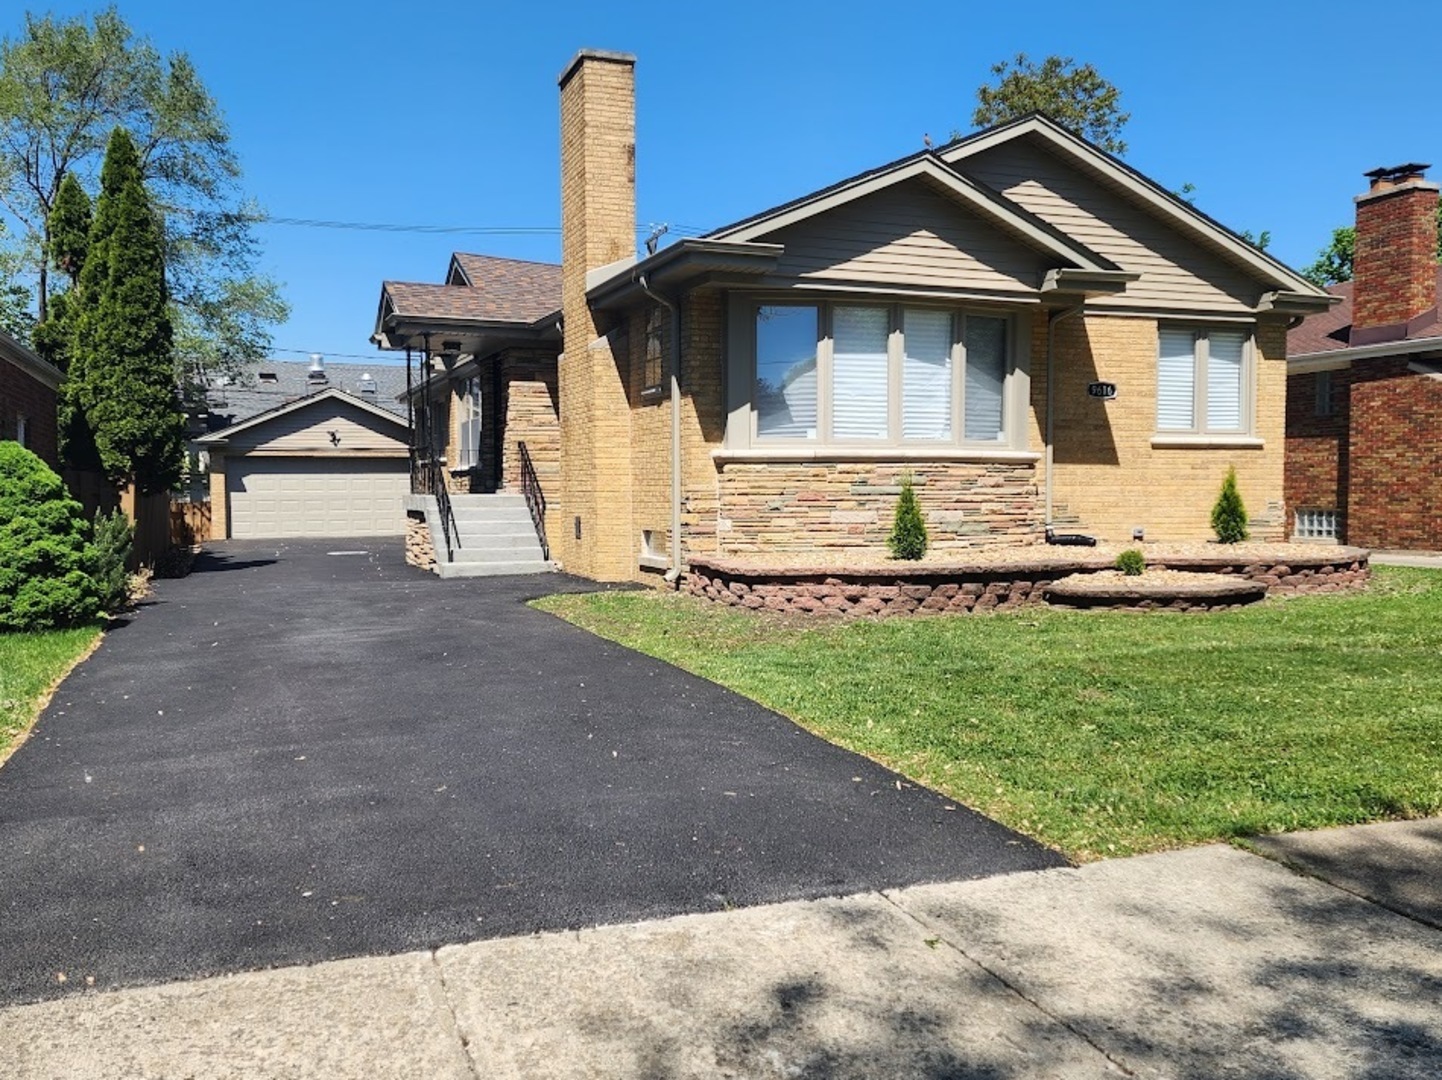
$599,000
3
bds
|
3
ba
|
3,900
sqft
|
built
1946
9616 S Claremont Ave, Chicago, IL 60643
$-1,527
Cash flow
-13.3%
Cash-on-Cash Return
2.6%
Cap rate
0.4%
Rent to Value Ratio
$1,899,000
6
bds
|
5
ba
|
7,000
sqft
|
built
2009
2632 N Talman Ave, Chicago, IL 60647
$-4,150
Cash flow
-11.4%
Cash-on-Cash Return
3.1%
Cap rate
0.5%
Rent to Value Ratio
$340,000
2
bds
|
2
ba
|
1,000
sqft
|
built
2002
2316 W Cortez St, Chicago, IL 60622
$-692
Cash flow
-10.6%
Cash-on-Cash Return
3.2%
Cap rate
0.7%
Rent to Value Ratio
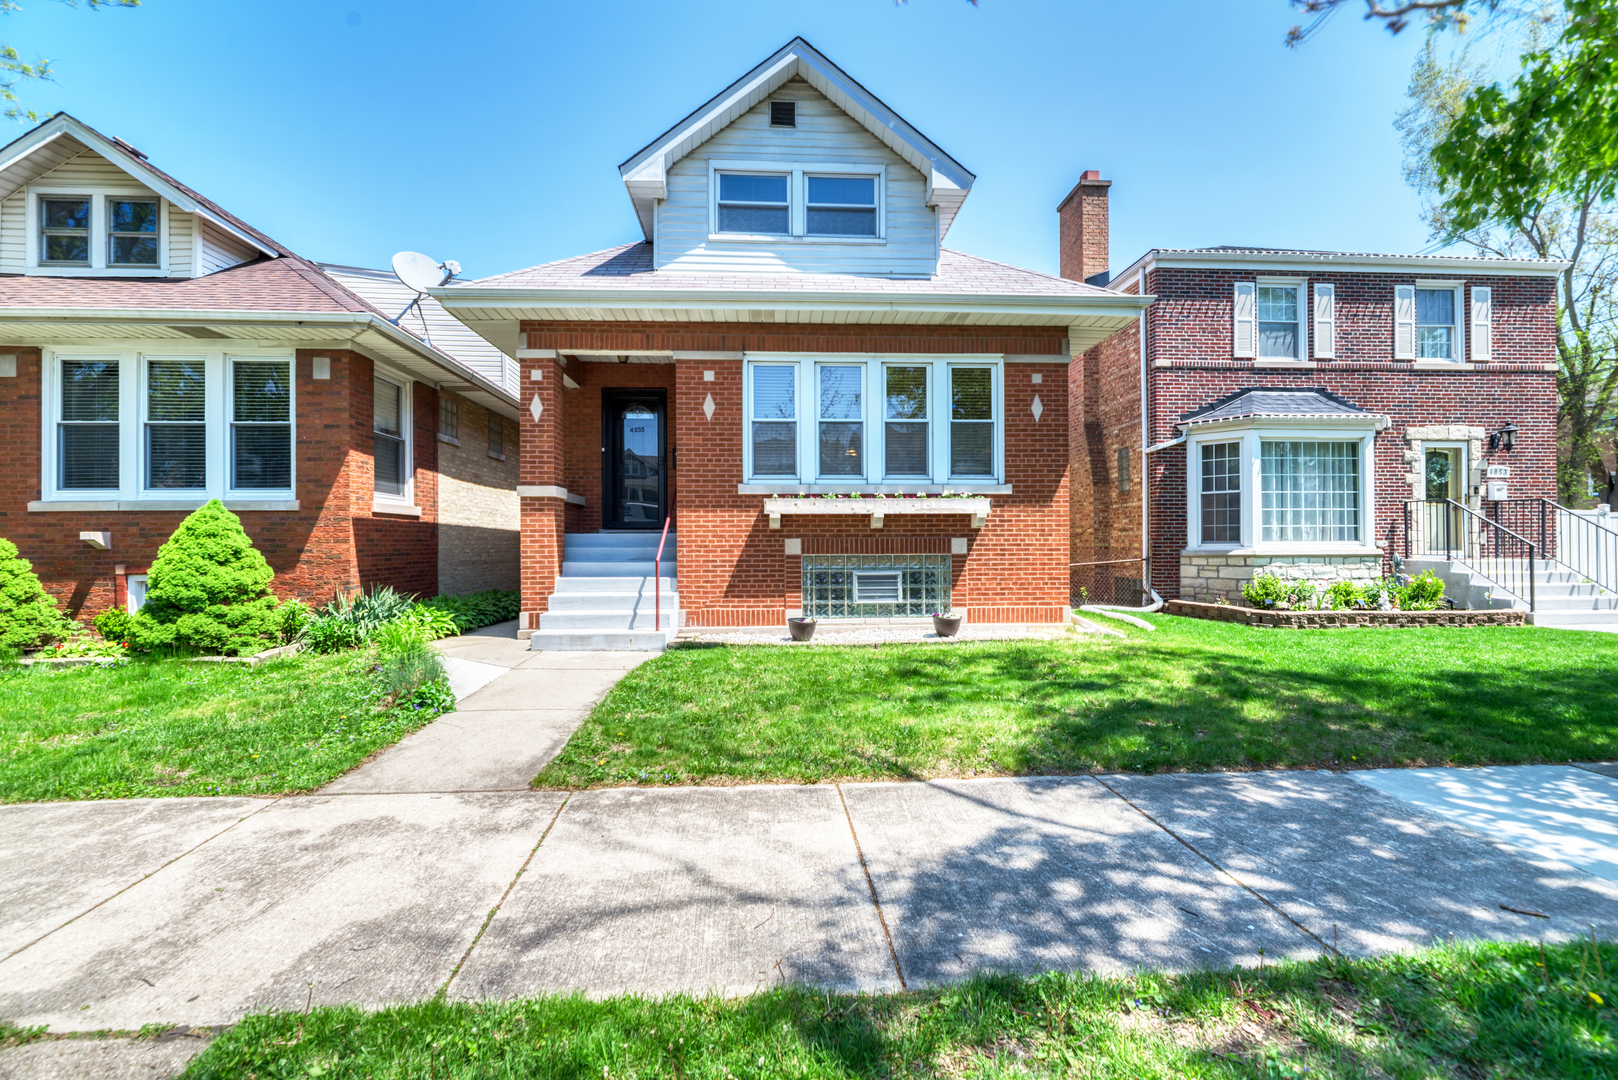
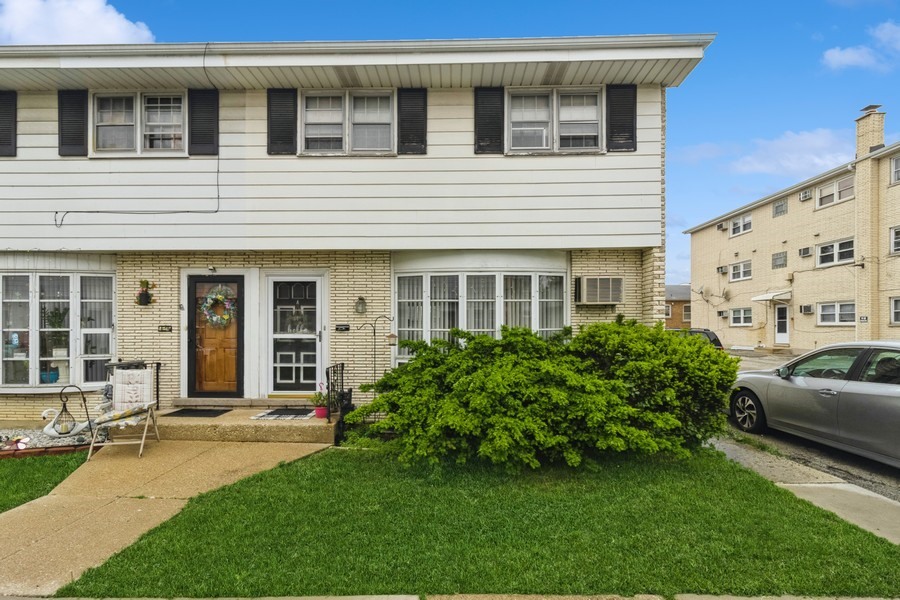
$485,000
4
bds
|
2
ba
|
1,550
sqft
|
built
1926
4855 N Mason Ave, Chicago, IL 60630
$-339
Cash flow
-3.6%
Cash-on-Cash Return
4.8%
Cap rate
0.7%
Rent to Value Ratio
$245,000
3
bds
|
2
ba
|
1,200
sqft
|
built
1963
5228 W 54th St, Chicago, IL 60638
$-3
Cash flow
-0.1%
Cash-on-Cash Return
5.7%
Cap rate
0.8%
Rent to Value Ratio
$275,000
1
bds
|
1
ba
|
750
sqft
|
built
1954
555 W Cornelia Ave, Chicago, IL 60657
$-802
Cash flow
-15.2%
Cash-on-Cash Return
2.2%
Cap rate
0.8%
Rent to Value Ratio
$529,900
3
bds
|
2
ba
|
0
sqft
|
built
1957
6341 N Lowell Ave, Chicago, IL 60646
$-831
Cash flow
-8.2%
Cash-on-Cash Return
3.8%
Cap rate
0.6%
Rent to Value Ratio
$250,000
4
bds
|
2
ba
|
0
sqft
|
built
1914
4942 S Racine Ave, Chicago, IL 60609
$-74
Cash flow
-1.5%
Cash-on-Cash Return
5.3%
Cap rate
0.7%
Rent to Value Ratio
$265,000
3
bds
|
2
ba
|
0
sqft
|
built
1967
6555 W Addison St, Chicago, IL 60634
$195
Cash flow
3.8%
Cash-on-Cash Return
6.6%
Cap rate
0.9%
Rent to Value Ratio
$179,900
7
bds
|
4
ba
|
0
sqft
|
built
1913
11739 S Indiana Ave, Chicago, IL 60628
$446
Cash flow
12.9%
Cash-on-Cash Return
8.7%
Cap rate
1.1%
Rent to Value Ratio
$175,000
2
bds
|
1
ba
|
950
sqft
|
built
1924
6254 N Richmond St, Chicago, IL 60659
$-82
Cash flow
-2.4%
Cash-on-Cash Return
5.1%
Cap rate
1.0%
Rent to Value Ratio
$345,000
1
bds
|
1
ba
|
1,093
sqft
|
built
1983
10 E Ontario St, Chicago, IL 60611
$-1,096
Cash flow
-16.6%
Cash-on-Cash Return
1.9%
Cap rate
0.8%
Rent to Value Ratio
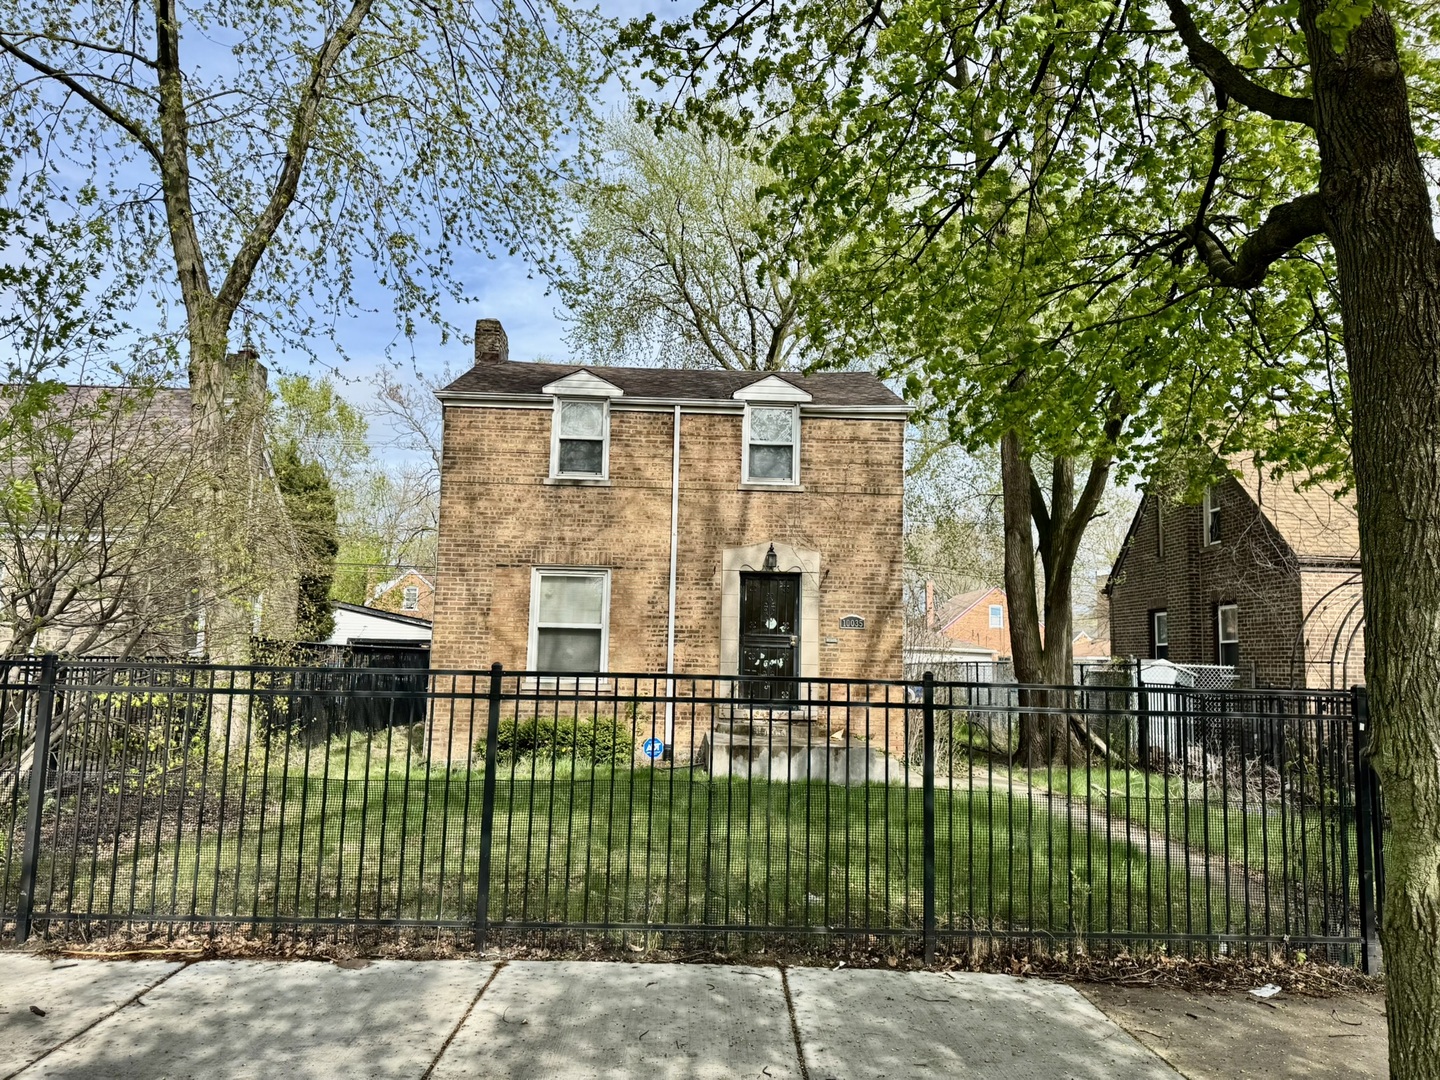
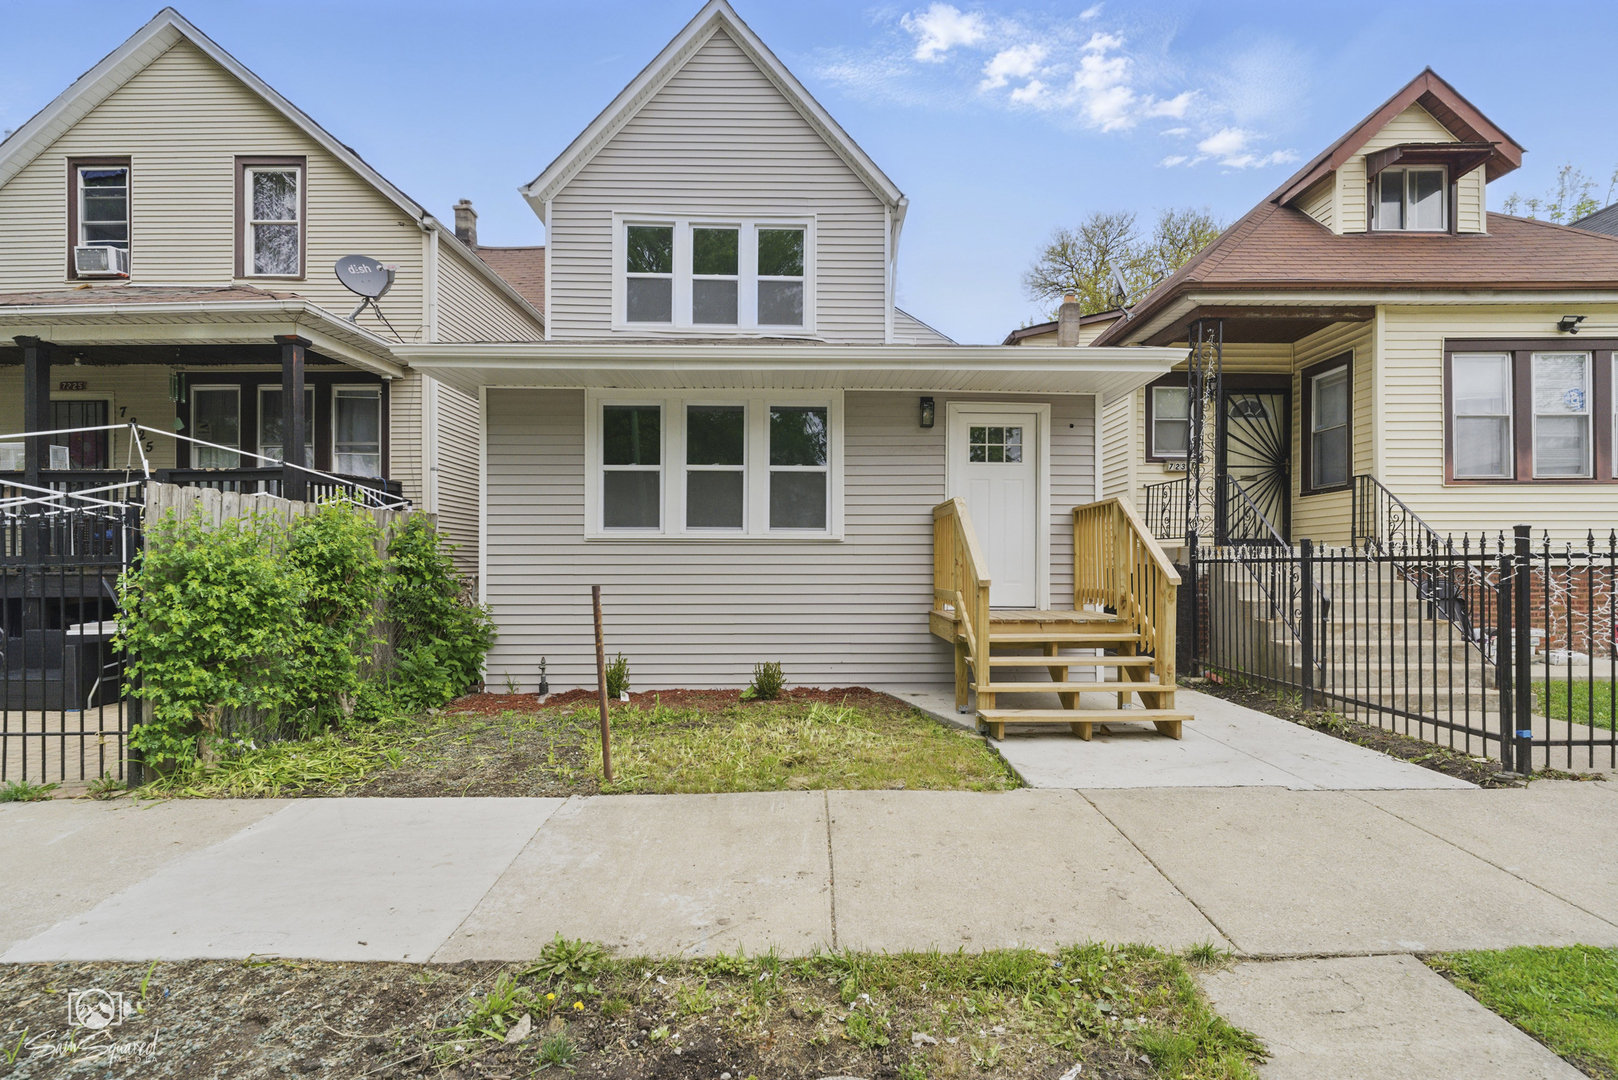
$169,000
4
bds
|
2
ba
|
1,380
sqft
|
built
1942
10035 S Yates Blvd, Chicago, IL 60617
$386
Cash flow
11.9%
Cash-on-Cash Return
8.4%
Cap rate
1.2%
Rent to Value Ratio
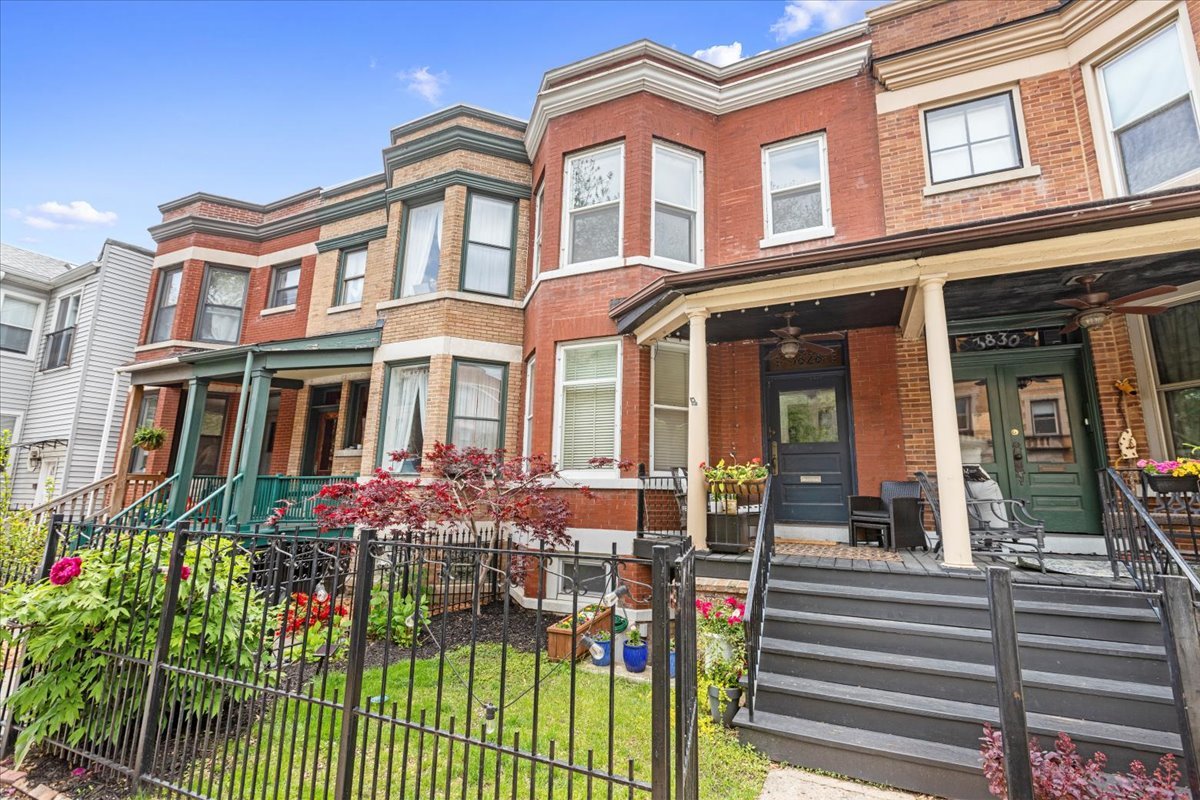
$700,000
3
bds
|
3
ba
|
0
sqft
|
built
1886
3828 N Wilton Ave, Chicago, IL 60613
$-977
Cash flow
-7.3%
Cash-on-Cash Return
4.0%
Cap rate
0.7%
Rent to Value Ratio
$255,000
4
bds
|
2
ba
|
1,439
sqft
|
built
1898
7227 S Paulina St, Chicago, IL 60636
$534
Cash flow
10.9%
Cash-on-Cash Return
8.2%
Cap rate
1.0%
Rent to Value Ratio
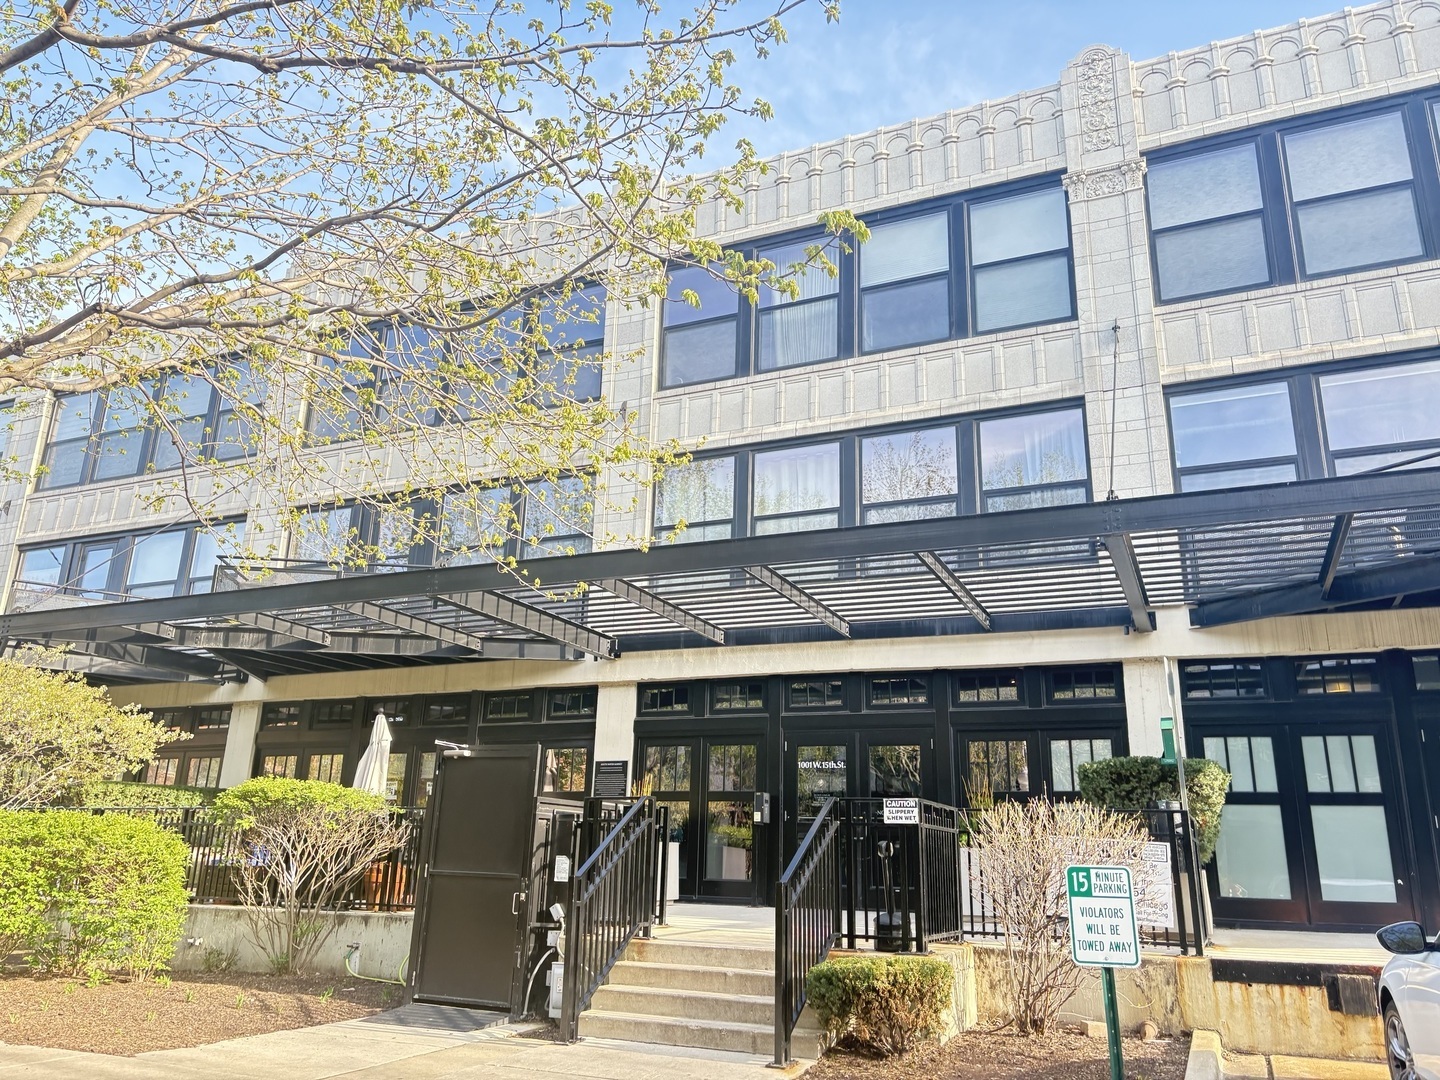
$330,000
2
bds
|
2
ba
|
980
sqft
|
built
1920
1001 W 15th St, Chicago, IL 60608
$-790
Cash flow
-12.5%
Cash-on-Cash Return
2.8%
Cap rate
0.8%
Rent to Value Ratio
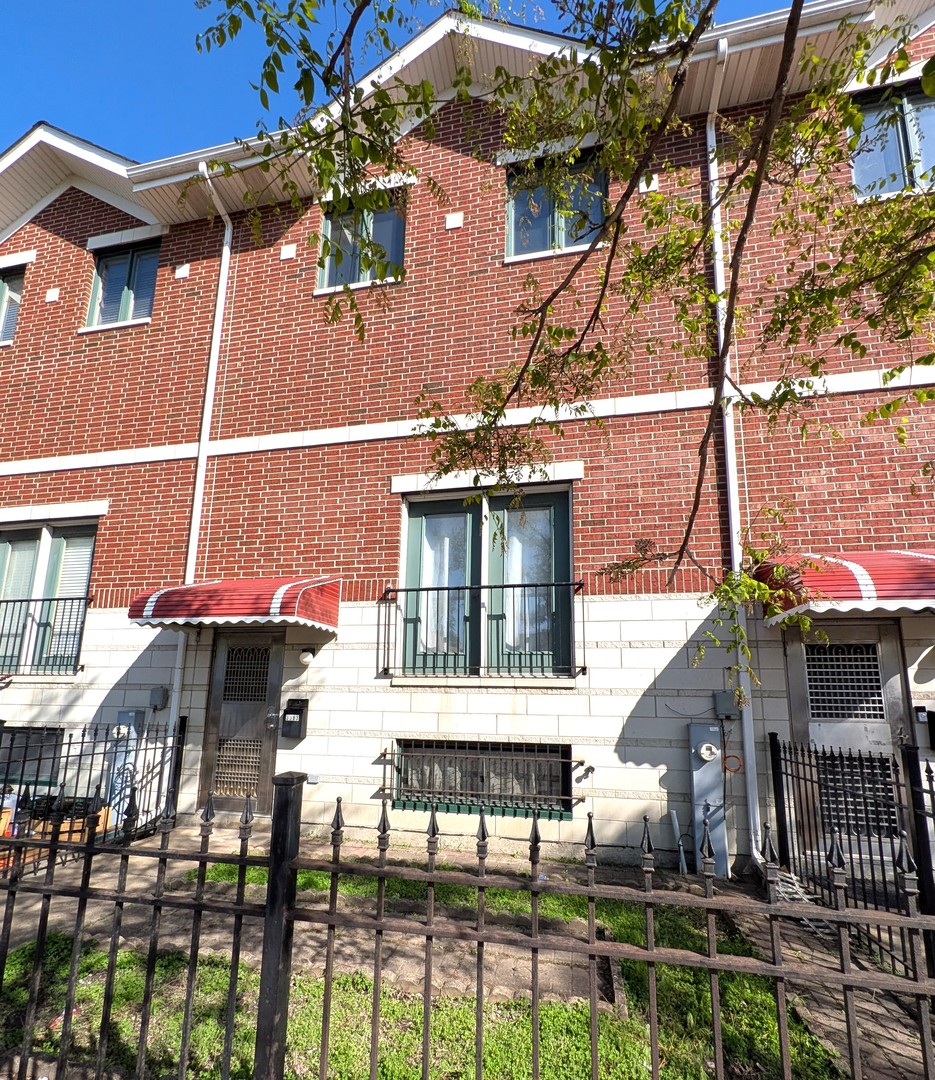
$428,000
3
bds
|
3
ba
|
2,030
sqft
|
built
2005
3383 S Archer Ave, Chicago, IL 60608
$-1,147
Cash flow
-14.0%
Cash-on-Cash Return
2.5%
Cap rate
0.5%
Rent to Value Ratio