San Antonio, TX Investment Properties for Sale
Browse homes for sale and investment properties in San Antonio, TX. Refine your search by price, property type, or more.
Best cash flowing properties in San Antonio, TX
Active
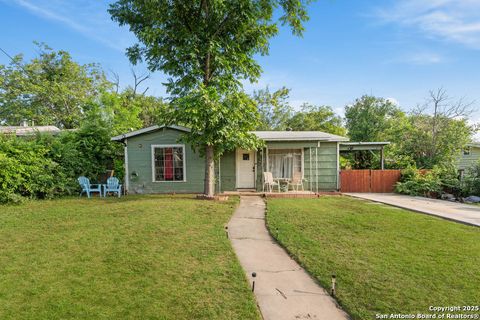
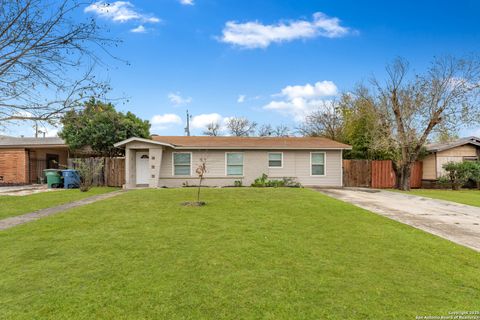
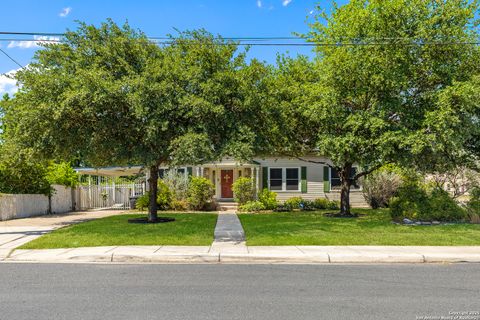
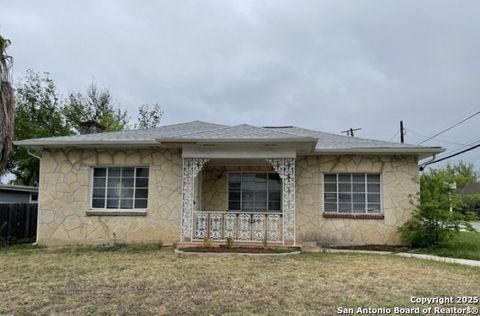
$180,000
4
bds
|
2
ba
|
1,524
sqft
|
built
1953
314 Woley Dr, San Antonio, TX 78228
$651
Cash flow
18.9%
Cash-on-Cash Return
10.6%
Cap rate
1.3%
Rent to Value Ratio
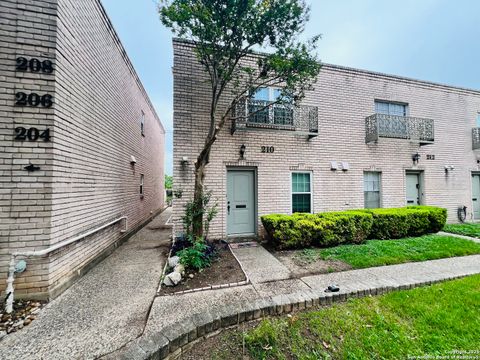
Active
$109,900
3
bds
|
1
ba
|
915
sqft
|
built
1955
158 Manning, San Antonio, TX 78228
$446
Cash flow
21.2%
Cash-on-Cash Return
10.5%
Cap rate
1.3%
Rent to Value Ratio
5,447 out of 5,712 properties for sale in San Antonio, TX
Limited Results Shown
Create a free account, or log in to reveal all property listings and enjoy the complete experience.
Active
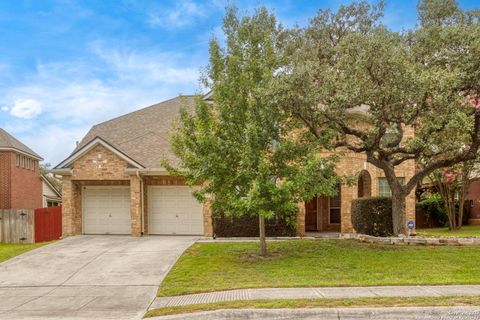
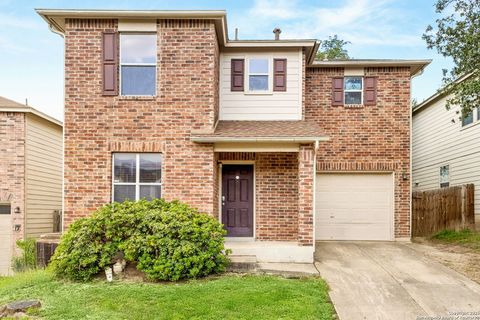
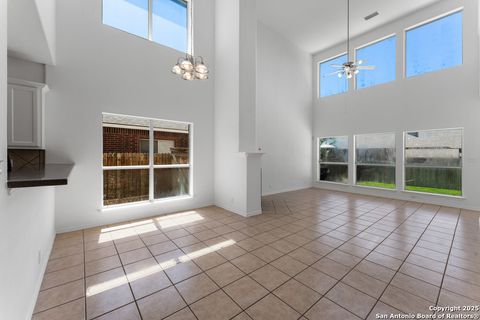
$365,000
4
bds
|
2
ba
|
2,500
sqft
|
built
2006
1515 Agency Pt, San Antonio, TX 78245
$-921
Cash flow
-13.2%
Cash-on-Cash Return
2.6%
Cap rate
0.5%
Rent to Value Ratio
Active
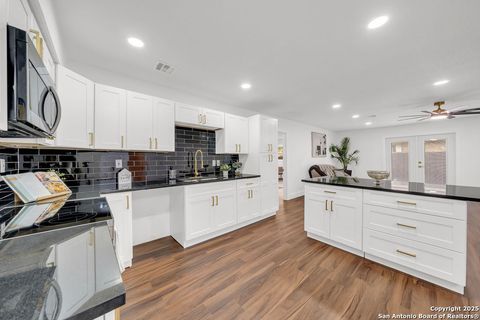
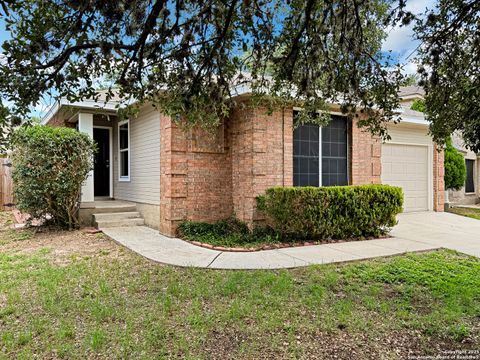
$169,900
2
bds
|
2
ba
|
1,119
sqft
|
built
1963
102 Ruelle, San Antonio, TX 78209
$-533
Cash flow
-16.4%
Cash-on-Cash Return
1.9%
Cap rate
0.8%
Rent to Value Ratio
Active
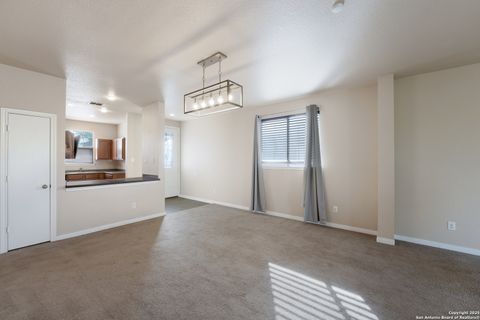
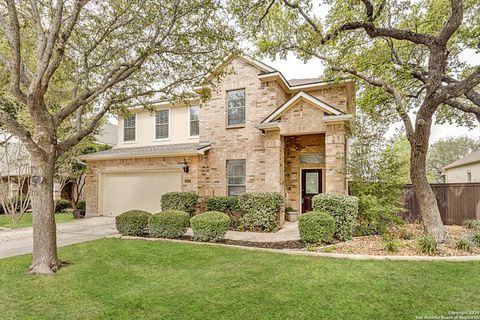
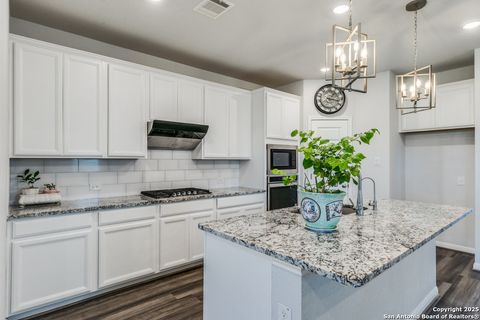
$295,000
3
bds
|
3
ba
|
2,453
sqft
|
built
2020
9821 Overlook Cyn, San Antonio, TX 78245
$-732
Cash flow
-12.9%
Cash-on-Cash Return
2.7%
Cap rate
0.6%
Rent to Value Ratio
Active
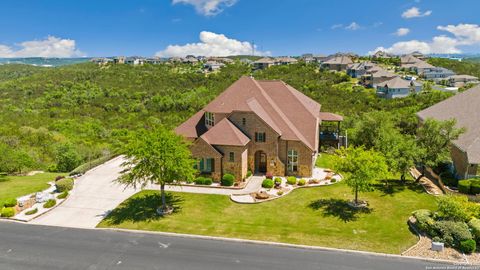
$1,105,000
5
bds
|
4
ba
|
4,171
sqft
|
built
2003
26006 Syrinx, San Antonio, TX 78260
$-2,687
Cash flow
-12.7%
Cash-on-Cash Return
2.8%
Cap rate
0.5%
Rent to Value Ratio
Active
$699,999
5
bds
|
5
ba
|
4,489
sqft
|
built
2010
7735 Stonewall Hl, San Antonio, TX 78256
$-2,993
Cash flow
-22.3%
Cash-on-Cash Return
0.5%
Cap rate
0.4%
Rent to Value Ratio
Active
$550,000
6
bds
|
0
ba
|
2,624
sqft
|
built
2020
13335 Rowdy Cv, San Antonio, TX 78249
$-2,396
Cash flow
-22.7%
Cash-on-Cash Return
0.5%
Cap rate
0.4%
Rent to Value Ratio
Active
$225,000
4
bds
|
1
ba
|
1,110
sqft
|
built
1961
910 Rexford Dr, San Antonio, TX 78216
$-388
Cash flow
-9.0%
Cash-on-Cash Return
3.6%
Cap rate
0.7%
Rent to Value Ratio
Active
$635,000
4
bds
|
4
ba
|
3,435
sqft
|
built
2006
819 Steubing Oaks, San Antonio, TX 78258
$-2,029
Cash flow
-16.7%
Cash-on-Cash Return
1.8%
Cap rate
0.5%
Rent to Value Ratio
Active
$279,000
4
bds
|
3
ba
|
1,664
sqft
|
built
1980
6326 Club Oaks St, San Antonio, TX 78249
$-538
Cash flow
-10.1%
Cash-on-Cash Return
3.4%
Cap rate
0.6%
Rent to Value Ratio
Active
$220,000
3
bds
|
2
ba
|
1,516
sqft
|
built
2009
13402 Solar Crst, San Antonio, TX 78245
$-303
Cash flow
-7.2%
Cash-on-Cash Return
4.0%
Cap rate
0.8%
Rent to Value Ratio
Active
$288,000
4
bds
|
2
ba
|
1,703
sqft
|
built
2019
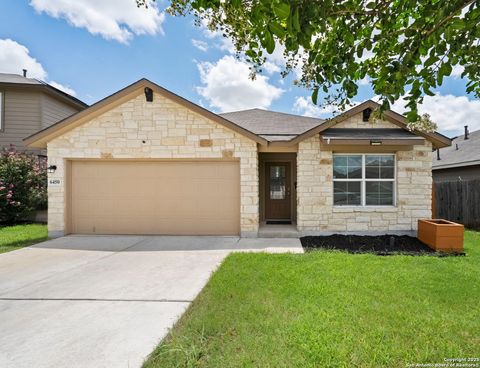
6450 Hoffman Pln, San Antonio, TX 78252
$-264
Cash flow
-4.8%
Cash-on-Cash Return
4.6%
Cap rate
0.7%
Rent to Value Ratio
Active
$310,000
4
bds
|
3
ba
|
2,164
sqft
|
built
1993
15074 Preston Hollow Dr, San Antonio, TX 78247
$-540
Cash flow
-9.1%
Cash-on-Cash Return
3.6%
Cap rate
0.7%
Rent to Value Ratio
Active
$355,000
3
bds
|
3
ba
|
2,575
sqft
|
built
1994
10935 Hamlen Park Dr S, San Antonio, TX 78249
$-962
Cash flow
-14.1%
Cash-on-Cash Return
2.4%
Cap rate
0.6%
Rent to Value Ratio
Active
$274,999
3
bds
|
2
ba
|
2,176
sqft
|
built
1994
807 S Ellison Dr, San Antonio, TX 78245
$-562
Cash flow
-10.7%
Cash-on-Cash Return
3.2%
Cap rate
0.7%
Rent to Value Ratio
Active
$249,999
3
bds
|
2
ba
|
1,802
sqft
|
built
2000
1605 W Winnipeg Ave, San Antonio, TX 78225
$-240
Cash flow
-5.0%
Cash-on-Cash Return
4.5%
Cap rate
0.8%
Rent to Value Ratio
Active
$233,000
3
bds
|
3
ba
|
1,721
sqft
|
built
2005
846 Barrel Pt, San Antonio, TX 78251
$-484
Cash flow
-10.8%
Cash-on-Cash Return
3.2%
Cap rate
0.7%
Rent to Value Ratio
Active
$233,900
3
bds
|
2
ba
|
1,310
sqft
|
built
1997
1222 Bobcat Pass, San Antonio, TX 78251
$-423
Cash flow
-9.4%
Cash-on-Cash Return
3.5%
Cap rate
0.7%
Rent to Value Ratio
Active
$549,777
5
bds
|
4
ba
|
3,104
sqft
|
built
2008
18827 Salado Cyn, San Antonio, TX 78258
$-1,376
Cash flow
-13.1%
Cash-on-Cash Return
2.7%
Cap rate
0.6%
Rent to Value Ratio
Active
$349,900
3
bds
|
2
ba
|
1,613
sqft
|
built
2010
5618 Thunder Oaks, San Antonio, TX 78261
$-818
Cash flow
-12.2%
Cash-on-Cash Return
2.9%
Cap rate
0.6%
Rent to Value Ratio
Active
$399,000
4
bds
|
4
ba
|
3,118
sqft
|
built
2000
21118 Carmel Hls, San Antonio, TX 78259
$-860
Cash flow
-11.2%
Cash-on-Cash Return
3.1%
Cap rate
0.7%
Rent to Value Ratio
Active
$260,000
3
bds
|
2
ba
|
1,942
sqft
|
built
2020
131 Broken Antler, San Antonio, TX 78253
$-378
Cash flow
-7.6%
Cash-on-Cash Return
3.9%
Cap rate
0.8%
Rent to Value Ratio
Active
$279,999
4
bds
|
3
ba
|
1,866
sqft
|
built
2022
13516 Waxman Spark, San Antonio, TX 78252
$-752
Cash flow
-14.0%
Cash-on-Cash Return
3.0%
Cap rate
0.6%
Rent to Value Ratio
Active
$260,000
3
bds
|
2
ba
|
1,194
sqft
|
built
1985
12527 Valle Dezavala, San Antonio, TX 78249
$-716
Cash flow
-14.4%
Cash-on-Cash Return
2.9%
Cap rate
0.6%
Rent to Value Ratio
Active
$220,000
3
bds
|
3
ba
|
2,095
sqft
|
built
1974
7711 Callaghan Rd, San Antonio, TX 78229
$-1,008
Cash flow
-23.9%
Cash-on-Cash Return
0.7%
Cap rate
0.8%
Rent to Value Ratio
Active
$599,000
4
bds
|
3
ba
|
2,728
sqft
|
built
2022
14414 Draft Horse, San Antonio, TX 78254
$-1,349
Cash flow
-11.8%
Cash-on-Cash Return
3.0%
Cap rate
0.6%
Rent to Value Ratio
Active
$485,000
4
bds
|
6
ba
|
2,280
sqft
|
built
2021
303 Pendleton Ave, San Antonio, TX 78204
$-1,122
Cash flow
-12.1%
Cash-on-Cash Return
2.9%
Cap rate
0.7%
Rent to Value Ratio
Active
$465,000
3
bds
|
3
ba
|
2,498
sqft
|
built
1994
13418 Stairock St, San Antonio, TX 78248
$-1,079
Cash flow
-12.1%
Cash-on-Cash Return
2.9%
Cap rate
0.7%
Rent to Value Ratio
Active
$245,000
4
bds
|
2
ba
|
1,416
sqft
|
built
1972
5802 Branch Valley St, San Antonio, TX 78242
$131
Cash flow
2.8%
Cash-on-Cash Return
6.3%
Cap rate
1.0%
Rent to Value Ratio
Active
$279,000
6
bds
|
3
ba
|
2,144
sqft
|
built
1984
13802 Escort Dr, San Antonio, TX 78233
$121
Cash flow
2.3%
Cash-on-Cash Return
6.8%
Cap rate
1.0%
Rent to Value Ratio
Active
$158,000
3
bds
|
2
ba
|
884
sqft
|
built
1982
9630 Simplicity Dr, San Antonio, TX 78245
$312
Cash flow
10.3%
Cash-on-Cash Return
8.6%
Cap rate
1.3%
Rent to Value Ratio
Active
$165,000
2
bds
|
4
ba
|
1,671
sqft
|
built
1964
533 Nolan St, San Antonio, TX 78202
$-274
Cash flow
-8.7%
Cash-on-Cash Return
3.7%
Cap rate
0.9%
Rent to Value Ratio
Active
$1,195,000
5
bds
|
5
ba
|
3,975
sqft
|
built
2012
8206 Winecup Hl, San Antonio, TX 78256
$-3,602
Cash flow
-15.7%
Cash-on-Cash Return
2.1%
Cap rate
0.5%
Rent to Value Ratio
Active
$485,000
4
bds
|
4
ba
|
2,778
sqft
|
built
2020
2407 Pesaro Pt, San Antonio, TX 78259
$-1,434
Cash flow
-15.4%
Cash-on-Cash Return
2.7%
Cap rate
0.6%
Rent to Value Ratio
Active
$415,000
4
bds
|
3
ba
|
2,325
sqft
|
built
2007
8206 Wayside Crk, San Antonio, TX 78255
$-1,219
Cash flow
-15.3%
Cash-on-Cash Return
2.7%
Cap rate
0.6%
Rent to Value Ratio
Active
$550,000
4
bds
|
3
ba
|
2,176
sqft
|
built
2010
4827 Ayrshire, San Antonio, TX 78217
$-1,720
Cash flow
-16.3%
Cash-on-Cash Return
1.9%
Cap rate
0.5%
Rent to Value Ratio
Active
$489,500
4
bds
|
3
ba
|
2,566
sqft
|
built
2019
12322 Saddle Up Dr, San Antonio, TX 78254
$-1,581
Cash flow
-16.9%
Cash-on-Cash Return
2.4%
Cap rate
0.5%
Rent to Value Ratio
Active
$625,000
5
bds
|
4
ba
|
3,302
sqft
|
built
2012
23567 Seven Winds, San Antonio, TX 78258
$-2,186
Cash flow
-18.2%
Cash-on-Cash Return
2.1%
Cap rate
0.5%
Rent to Value Ratio
Active
$369,900
4
bds
|
3
ba
|
2,871
sqft
|
built
1995
11053 Cedar Park, San Antonio, TX 78249
$-949
Cash flow
-13.4%
Cash-on-Cash Return
3.2%
Cap rate
0.7%
Rent to Value Ratio