Oklahoma City, OK Investment Properties for Sale
Browse homes for sale and investment properties in Oklahoma City, OK. Refine your search by price, property type, or more.
Best cash flowing properties in Oklahoma City, OK
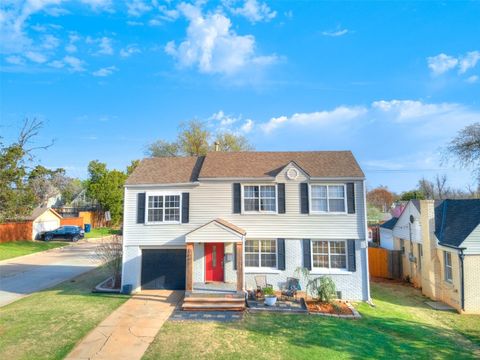
Active
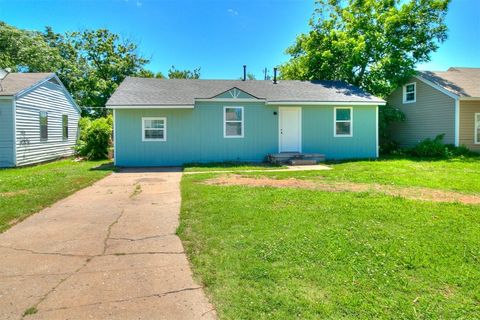
$110,000
2
bds
|
1
ba
|
0
sqft
|
built
1953
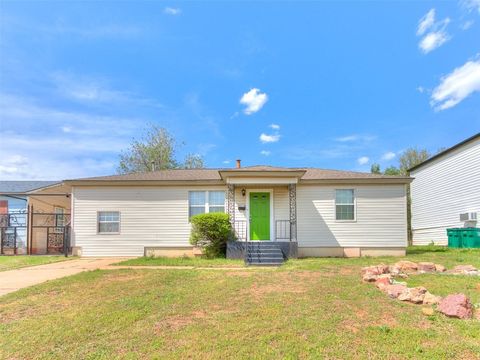
3109 NE 15th St, Oklahoma City, OK 73117
$273
Cash flow
12.9%
Cash-on-Cash Return
8.7%
Cap rate
1.1%
Rent to Value Ratio
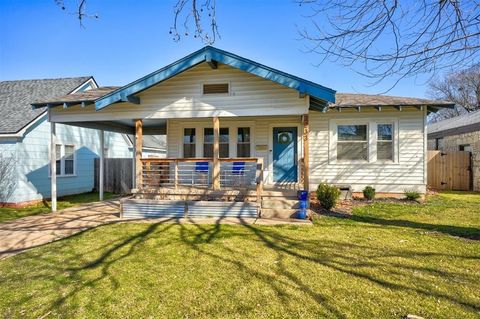
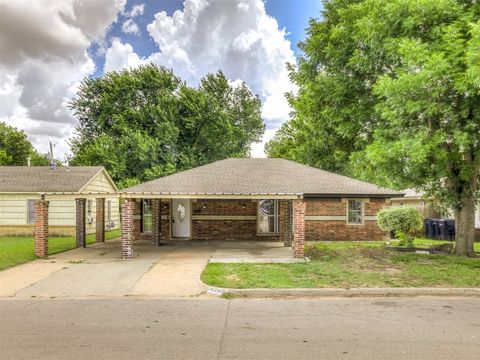
Active
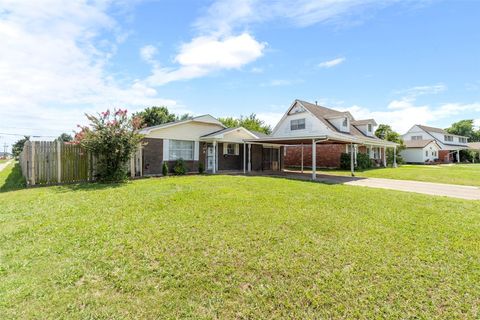
$179,900
3
bds
|
2
ba
|
0
sqft
|
built
1966
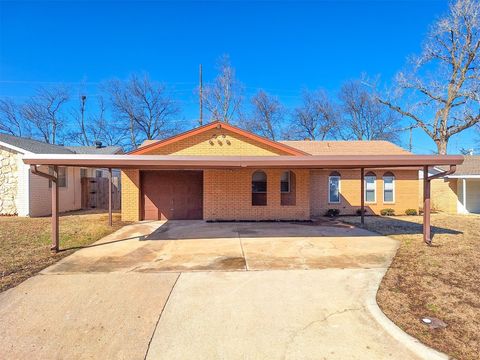
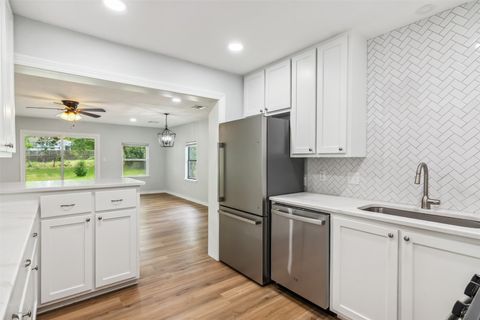
4713 Meench Dr, Oklahoma City, OK 73115
$182
Cash flow
5.3%
Cash-on-Cash Return
6.9%
Cap rate
0.9%
Rent to Value Ratio
1,213 out of 1,570 properties for sale in Oklahoma City, OK
Limited Results Shown
Create a free account, or log in to reveal all property listings and enjoy the complete experience.
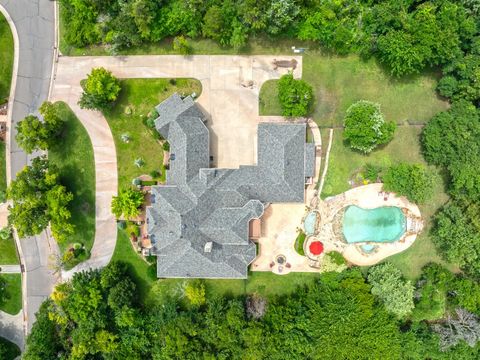
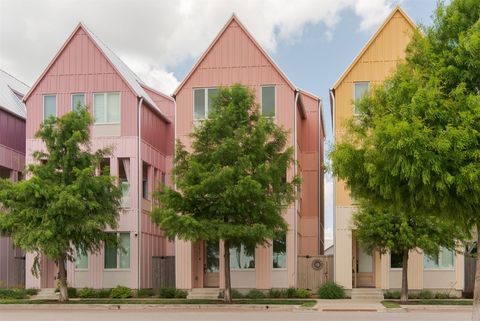
Active
$5,500,000
4
bds
|
7
ba
|
10,891
sqft
|
built
1987
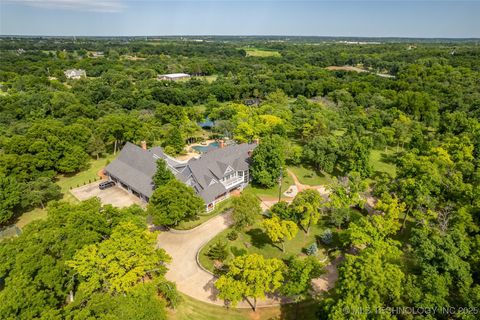
2701 Twin Creek Dr, Oklahoma City, OK 73131
$-24,417
Cash flow
-23.2%
Cash-on-Cash Return
0.4%
Cap rate
0.1%
Rent to Value Ratio
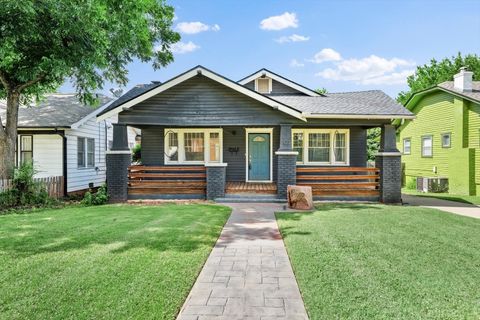
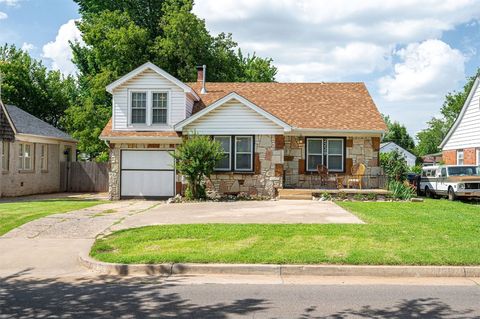
Active
$296,500
3
bds
|
2
ba
|
0
sqft
|
built
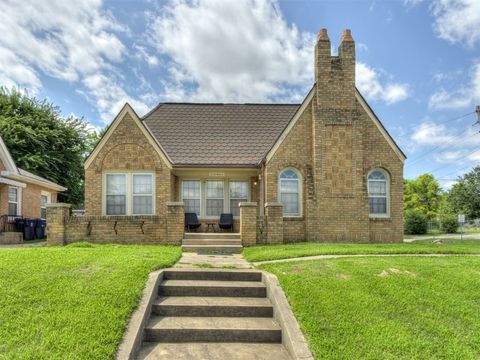
1926
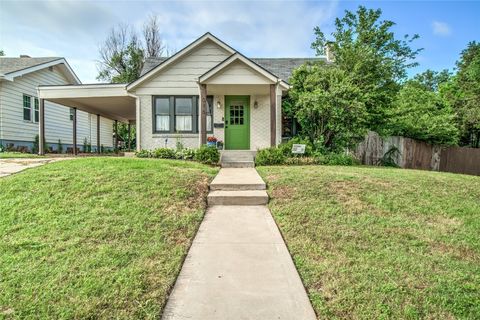
616 NW Eubanks St, Oklahoma City, OK 73118
$-487
Cash flow
-8.6%
Cash-on-Cash Return
3.7%
Cap rate
0.6%
Rent to Value Ratio
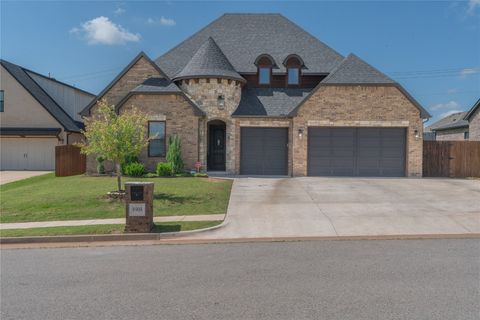
Active
$444,900
3
bds
|
2
ba
|
0
sqft
|
built
1930
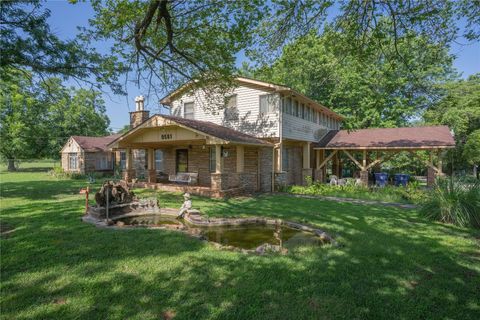
9501 N Bryant Ave, Oklahoma City, OK 73131
$-312
Cash flow
-3.7%
Cash-on-Cash Return
4.8%
Cap rate
0.6%
Rent to Value Ratio
Active
$277,000
3
bds
|
2
ba
|
0
sqft
|
built
1956
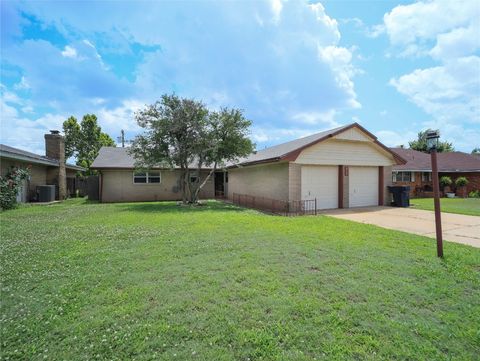
1847 N Allen Ln, Oklahoma City, OK 73127
$-136
Cash flow
-2.6%
Cash-on-Cash Return
5.1%
Cap rate
0.6%
Rent to Value Ratio
Active
$234,900
3
bds
|
1
ba
|
0
sqft
|
built
1950
5409 N Walker Ave, Oklahoma City, OK 73118
$-239
Cash flow
-5.3%
Cash-on-Cash Return
4.5%
Cap rate
0.7%
Rent to Value Ratio
Active
$265,000
4
bds
|
2
ba
|
0
sqft
|
built
1977
8813 Aaron Dr, Oklahoma City, OK 73132
$-166
Cash flow
-3.3%
Cash-on-Cash Return
4.9%
Cap rate
0.7%
Rent to Value Ratio
Active
$320,000
4
bds
|
3
ba
|
0
sqft
|
built
1981
617 SW 104th Pl, Oklahoma City, OK 73139
$73
Cash flow
1.2%
Cash-on-Cash Return
6.0%
Cap rate
0.7%
Rent to Value Ratio
Active
$275,000
2
bds
|
1
ba
|
0
sqft
|
built
1925
615 NW 26th St, Oklahoma City, OK 73103
$-301
Cash flow
-5.7%
Cash-on-Cash Return
4.4%
Cap rate
0.6%
Rent to Value Ratio
Active
$349,000
4
bds
|
4
ba
|
0
sqft
|
built
1930
1500 N Drexel Blvd, Oklahoma City, OK 73107
$-1,014
Cash flow
-15.2%
Cash-on-Cash Return
2.2%
Cap rate
0.4%
Rent to Value Ratio
Active
$349,000
3
bds
|
3
ba
|
0
sqft
|
built
1920
1412 NW 34th St, Oklahoma City, OK 73118
$-489
Cash flow
-7.3%
Cash-on-Cash Return
4.0%
Cap rate
0.6%
Rent to Value Ratio
Active
$584,900
4
bds
|
4
ba
|
0
sqft
|
built
2013
8509 NW 125th St, Oklahoma City, OK 73142
$-1,263
Cash flow
-11.3%
Cash-on-Cash Return
3.6%
Cap rate
0.6%
Rent to Value Ratio
Active
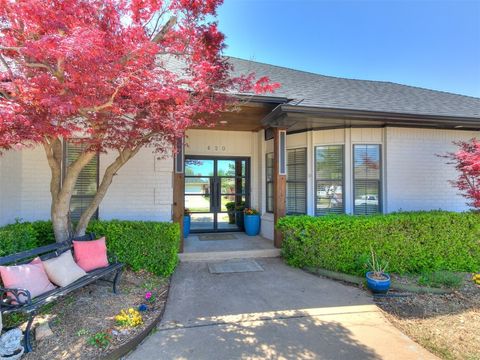
$399,900
3
bds
|
2
ba
|
0
sqft
|
built
1984
620 SW 113th St, Oklahoma City, OK 73170
$-843
Cash flow
-11.0%
Cash-on-Cash Return
3.1%
Cap rate
0.5%
Rent to Value Ratio
Active
$295,900
3
bds
|
2
ba
|
0
sqft
|
built
1998
12525 S Youngs Pl, Oklahoma City, OK 73170
$-292
Cash flow
-5.1%
Cash-on-Cash Return
4.5%
Cap rate
0.7%
Rent to Value Ratio
Active
$639,900
4
bds
|
3
ba
|
0
sqft
|
built
2007
11800 Pamalos Trl, Oklahoma City, OK 73173
$-1,383
Cash flow
-11.3%
Cash-on-Cash Return
3.1%
Cap rate
0.5%
Rent to Value Ratio
Active
$279,900
3
bds
|
2
ba
|
0
sqft
|
built
1939
2647 NW 24th St, Oklahoma City, OK 73107
$-495
Cash flow
-9.2%
Cash-on-Cash Return
4.1%
Cap rate
0.6%
Rent to Value Ratio
Active
$204,900
2
bds
|
1
ba
|
0
sqft
|
built
1934
2233 W Eubanks St, Oklahoma City, OK 73112
$84
Cash flow
2.1%
Cash-on-Cash Return
6.2%
Cap rate
0.9%
Rent to Value Ratio
Active
$230,000
3
bds
|
2
ba
|
0
sqft
|
built
1940
2629 Cashion Pl, Oklahoma City, OK 73112
$-155
Cash flow
-3.5%
Cash-on-Cash Return
4.9%
Cap rate
0.7%
Rent to Value Ratio
Active
$150,000
2
bds
|
1
ba
|
0
sqft
|
built
1937
1624 N Mc Millan Ave, Oklahoma City, OK 73127
$6
Cash flow
0.2%
Cash-on-Cash Return
5.7%
Cap rate
0.8%
Rent to Value Ratio
Active
$169,500
3
bds
|
2
ba
|
0
sqft
|
built
1952
4024 S Brookline Ave, Oklahoma City, OK 73119
$60
Cash flow
1.8%
Cash-on-Cash Return
6.1%
Cap rate
0.8%
Rent to Value Ratio
Active
$215,000
2
bds
|
1
ba
|
0
sqft
|
built
1922
833 NW 34th St, Oklahoma City, OK 73118
$-34
Cash flow
-0.8%
Cash-on-Cash Return
5.5%
Cap rate
0.8%
Rent to Value Ratio
Active
$539,900
4
bds
|
3
ba
|
0
sqft
|
built
2020
8908 NW 130th St, Oklahoma City, OK 73142
$-999
Cash flow
-9.7%
Cash-on-Cash Return
3.5%
Cap rate
0.6%
Rent to Value Ratio
Active
$1,475,000
5
bds
|
7
ba
|
0
sqft
|
built
2006
11801 Old Mill Rd, Oklahoma City, OK 73131
$-5,456
Cash flow
-19.3%
Cash-on-Cash Return
1.2%
Cap rate
0.2%
Rent to Value Ratio
Active
$190,000
3
bds
|
2
ba
|
0
sqft
|
built
1964
516 SW 63rd Ter, Oklahoma City, OK 73139
$50
Cash flow
1.4%
Cash-on-Cash Return
6.0%
Cap rate
0.8%
Rent to Value Ratio
Active
$220,000
3
bds
|
1
ba
|
0
sqft
|
built
1931
2560 NW 23rd St, Oklahoma City, OK 73107
$-129
Cash flow
-3.1%
Cash-on-Cash Return
5.0%
Cap rate
0.7%
Rent to Value Ratio
Active
$175,000
2
bds
|
1
ba
|
0
sqft
|
built
1952
1436 NW 97th St, Oklahoma City, OK 73114
$-83
Cash flow
-2.5%
Cash-on-Cash Return
5.1%
Cap rate
0.7%
Rent to Value Ratio
Active
$259,000
3
bds
|
2
ba
|
0
sqft
|
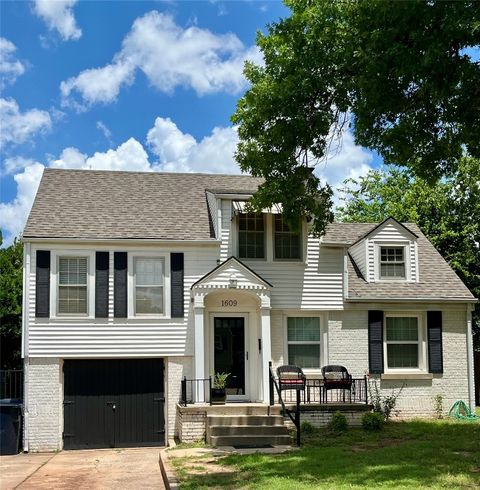
built
1938
1609 NW 43rd St, Oklahoma City, OK 73118
$-122
Cash flow
-2.5%
Cash-on-Cash Return
5.1%
Cap rate
0.8%
Rent to Value Ratio
Active
$750,000
4
bds
|
4
ba
|
0
sqft
|
built
2012
14424 Caledonia Way, Oklahoma City, OK 73142
$-1,805
Cash flow
-12.6%
Cash-on-Cash Return
2.8%
Cap rate
0.5%
Rent to Value Ratio
Active
$249,900
3
bds
|
2
ba
|
0
sqft
|
built
2018
4004 Brougham Way, Oklahoma City, OK 73179
$-222
Cash flow
-4.6%
Cash-on-Cash Return
4.6%
Cap rate
0.7%
Rent to Value Ratio
Active
$435,250
3
bds
|
2
ba
|
0
sqft
|
built
1954
2642 NW 42nd St, Oklahoma City, OK 73112
$-306
Cash flow
-3.7%
Cash-on-Cash Return
4.8%
Cap rate
0.6%
Rent to Value Ratio
Active
$230,000
5
bds
|
3
ba
|
0
sqft
|
built
1961
6413 S Mc Kinley Ave, Oklahoma City, OK 73139
$75
Cash flow
1.7%
Cash-on-Cash Return
6.1%
Cap rate
0.8%
Rent to Value Ratio
Active
$137,500
3
bds
|
1
ba
|
0
sqft
|
built
1948
3320 S Woodward Ave, Oklahoma City, OK 73119
$-76
Cash flow
-2.9%
Cash-on-Cash Return
5.0%
Cap rate
0.7%
Rent to Value Ratio
Active
$189,900
3
bds
|
2
ba
|
0
sqft
|
built
1964
2900 SW 61st St, Oklahoma City, OK 73159
$-55
Cash flow
-1.5%
Cash-on-Cash Return
5.3%
Cap rate
0.7%
Rent to Value Ratio
Active
$535,000
3
bds
|
3
ba
|
0
sqft
|
built
2021
1821 Wheeler St, Oklahoma City, OK 73108
$-1,415
Cash flow
-13.8%
Cash-on-Cash Return
2.5%
Cap rate
0.3%
Rent to Value Ratio

Active
$679,000
3
bds
|
4
ba
|
0
sqft
|
built
2023
2644 NW 57th St, Oklahoma City, OK 73112
$-1,827
Cash flow
-14.0%
Cash-on-Cash Return
3.0%
Cap rate
0.5%
Rent to Value Ratio
Active
$210,000
3
bds
|
1
ba
|
0
sqft
|
built
1935
2229 NW 30th St, Oklahoma City, OK 73112
$-55
Cash flow
-1.4%
Cash-on-Cash Return
5.4%
Cap rate
0.8%
Rent to Value Ratio
Active
$204,000
4
bds
|
2
ba
|
0
sqft
|
built
1951
1529 NE 44th St, Oklahoma City, OK 73111
$-300
Cash flow
-7.7%
Cash-on-Cash Return
3.9%
Cap rate
0.5%
Rent to Value Ratio
Active
$355,000
3
bds
|
3
ba
|
0
sqft
|
built
2009
8509 NW 111th St, Oklahoma City, OK 73162
$-527
Cash flow
-7.7%
Cash-on-Cash Return
3.9%
Cap rate
0.6%
Rent to Value Ratio

Active
$500,000
4
bds
|
4
ba
|
0
sqft
|
built
2000
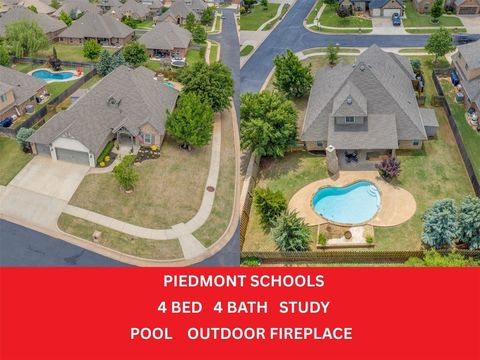
2600 SW 120th St, Oklahoma City, OK 73170
$-1,033
Cash flow
-10.8%
Cash-on-Cash Return
3.2%
Cap rate
0.5%
Rent to Value Ratio